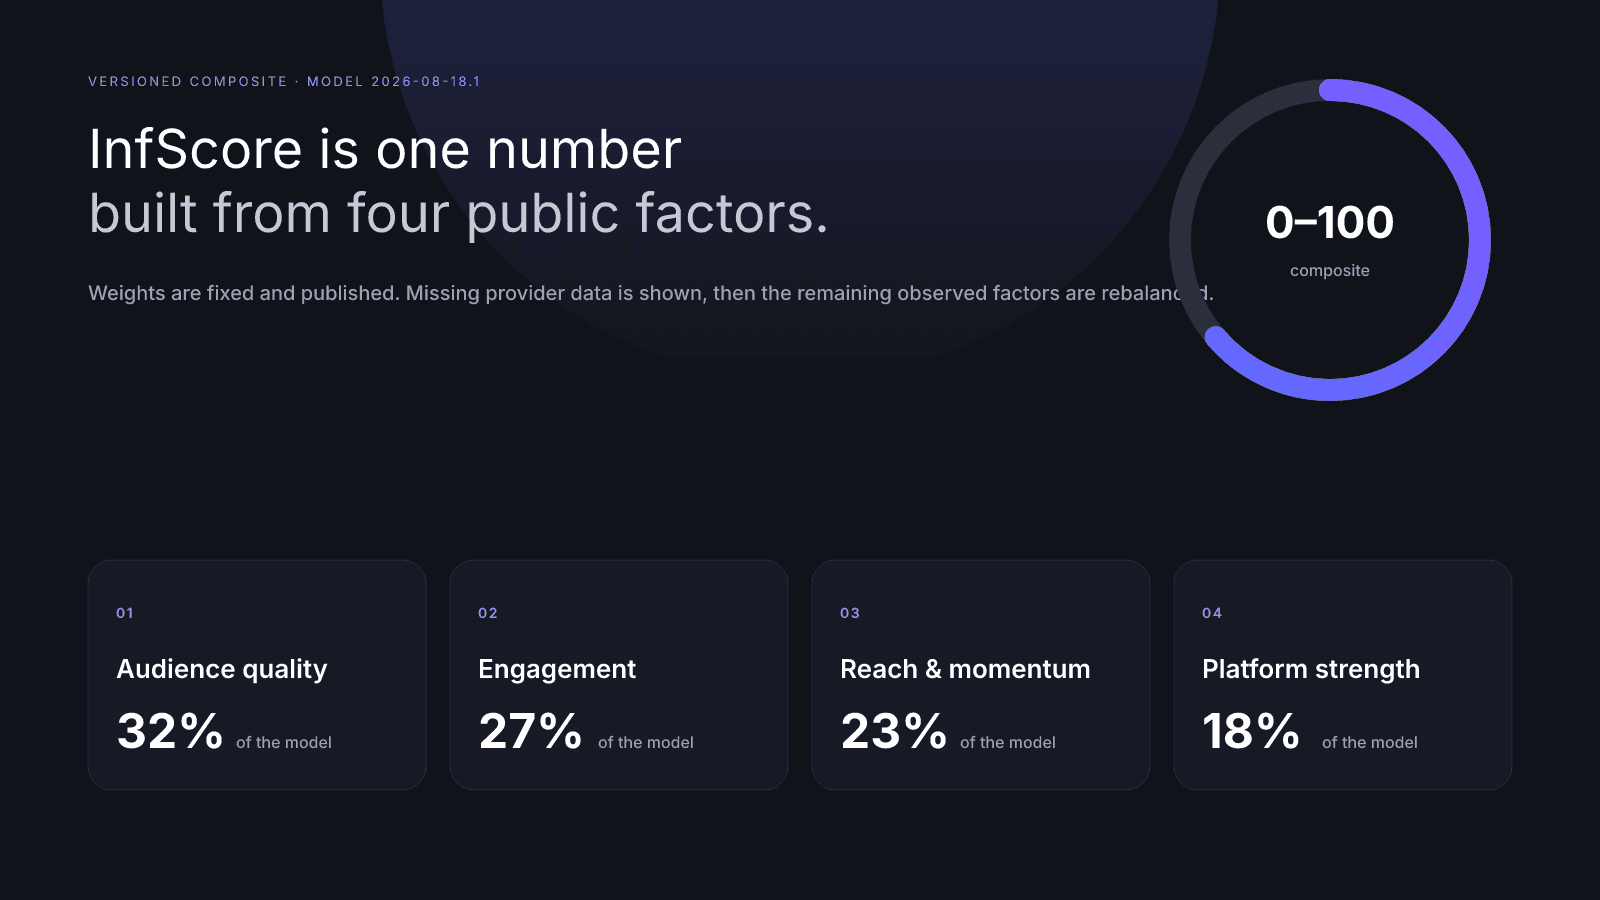
How public influence gets a number.
Long-form notes from InfScore Editorial on the versioned 0–100 score, the four published factors, and how to read a scorecard when some of the data is missing.
What Brands Should Read First on an InfScore Card
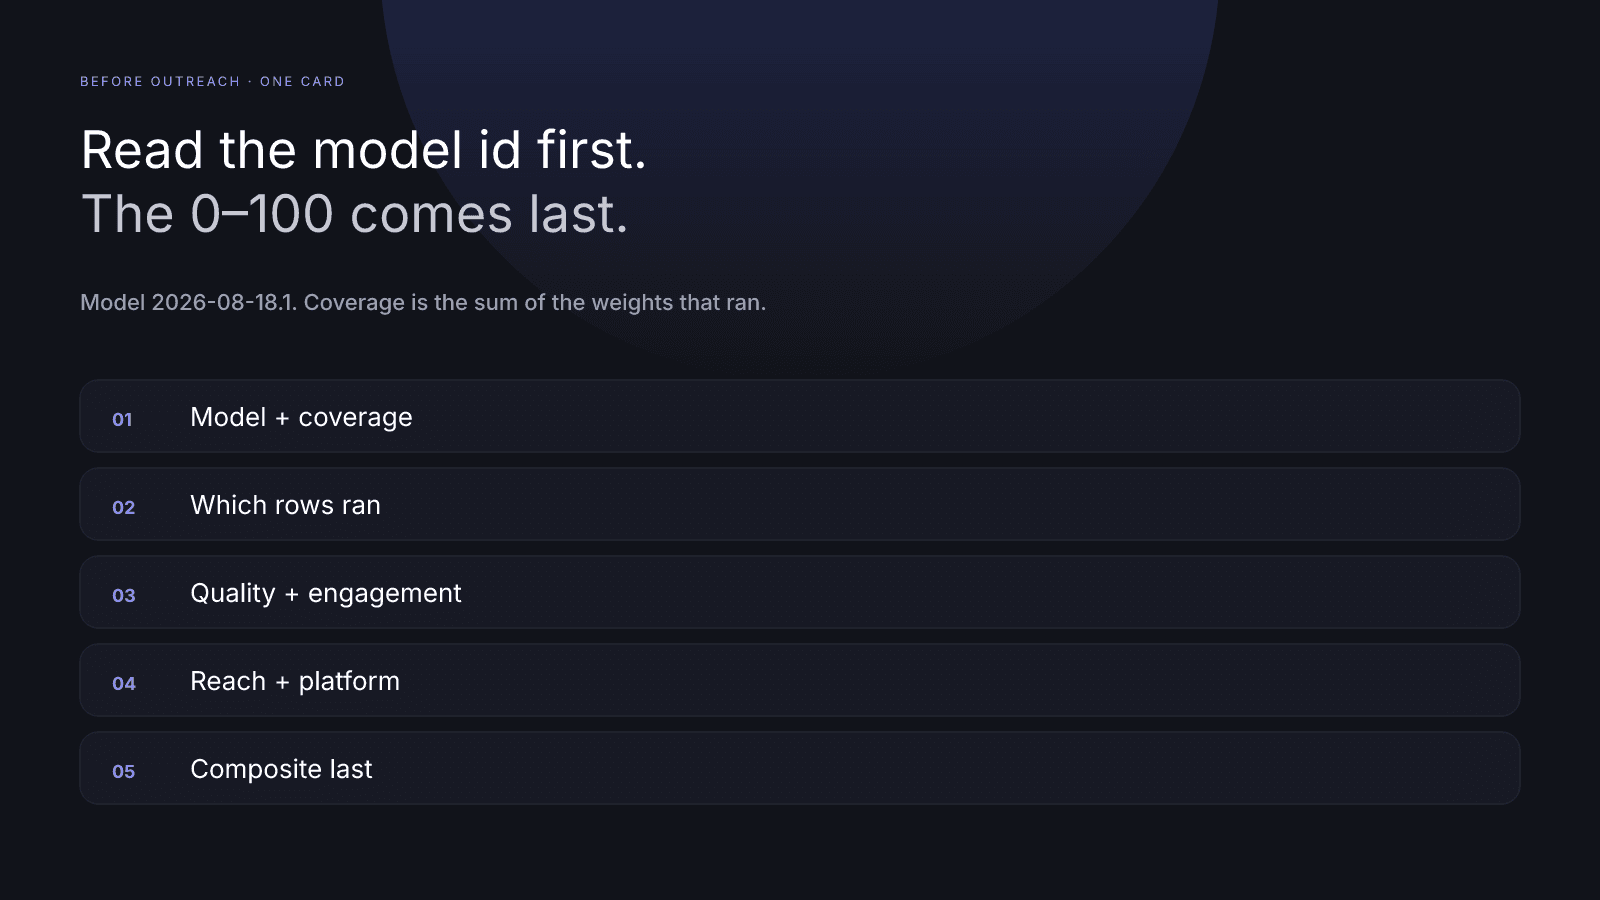
Before outreach, read an InfScore card in order: model and coverage first, then audience quality and engagement, and the headline score last.
Why High Follower Counts Still Score Low
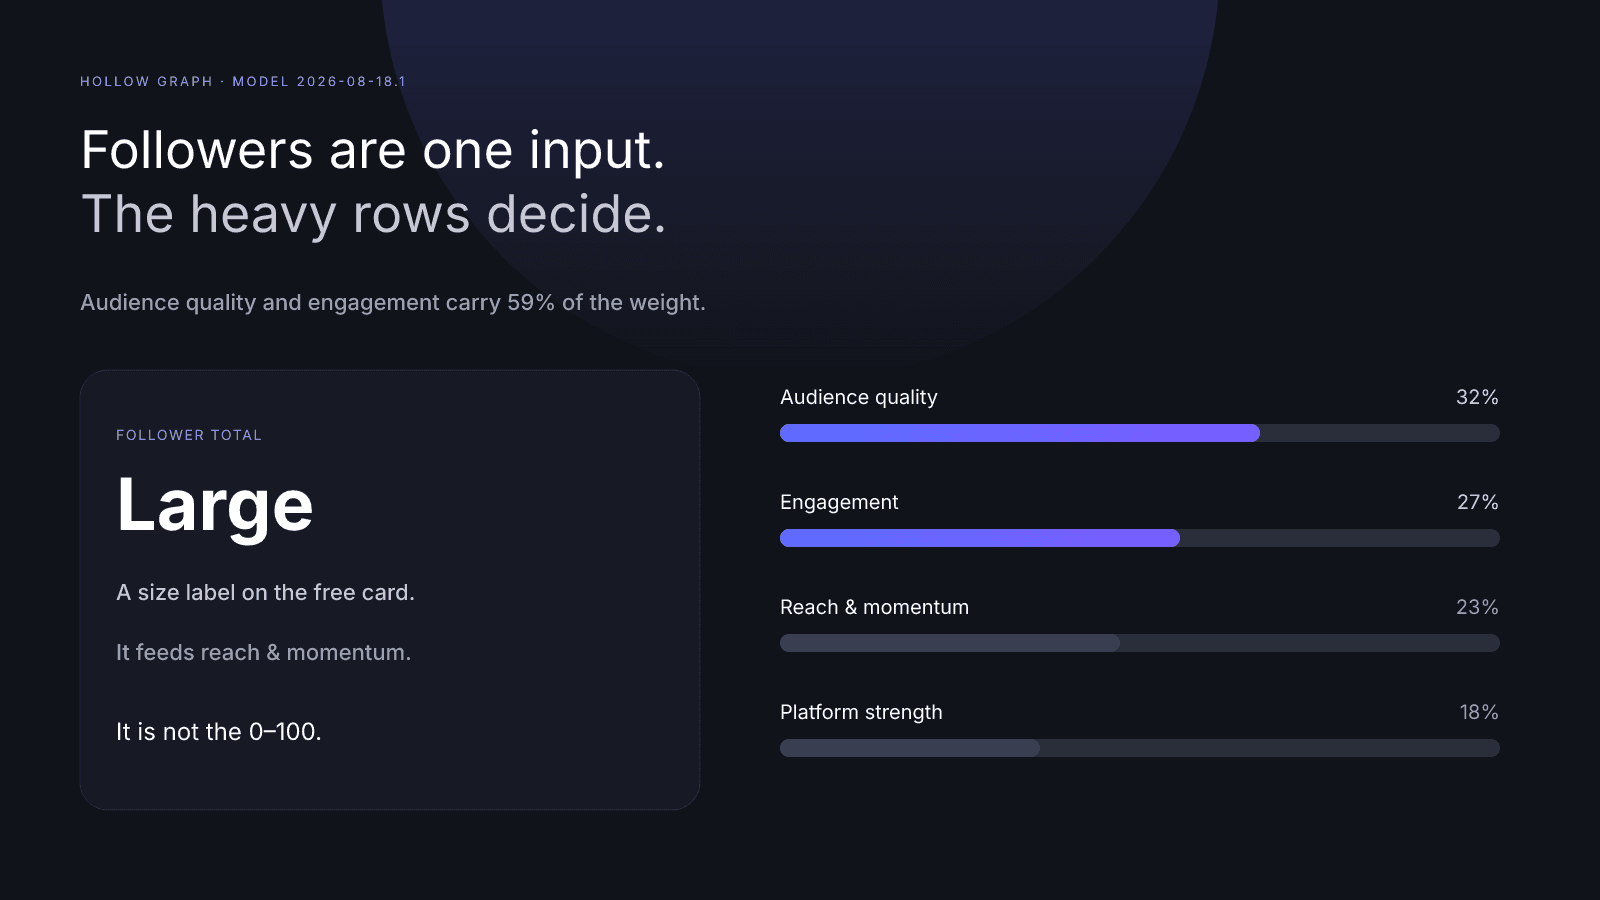
A big follower count is one input, not the score. Audience quality and engagement carry 59% of InfScore, so hollow audiences score low.
Comparing Two Creators Fairly With InfScore
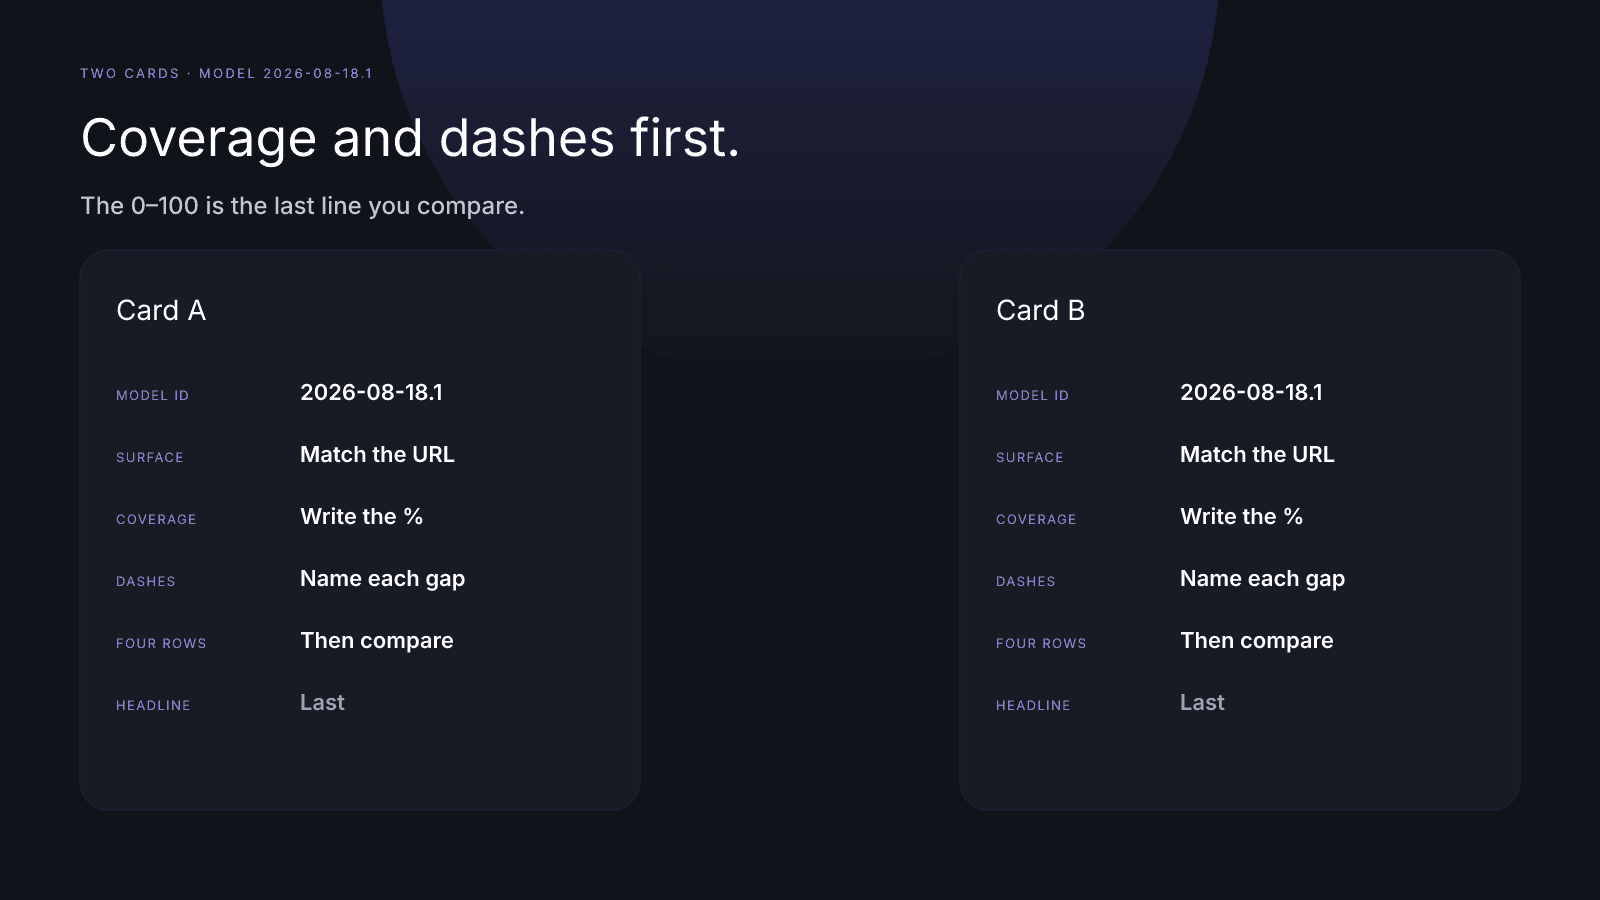
Before you rank two creators by InfScore, match the model id and platform, then check coverage and dashes. Compare the headline number last.
Comparing InfScore Across Model Versions Without Fooling Yourself
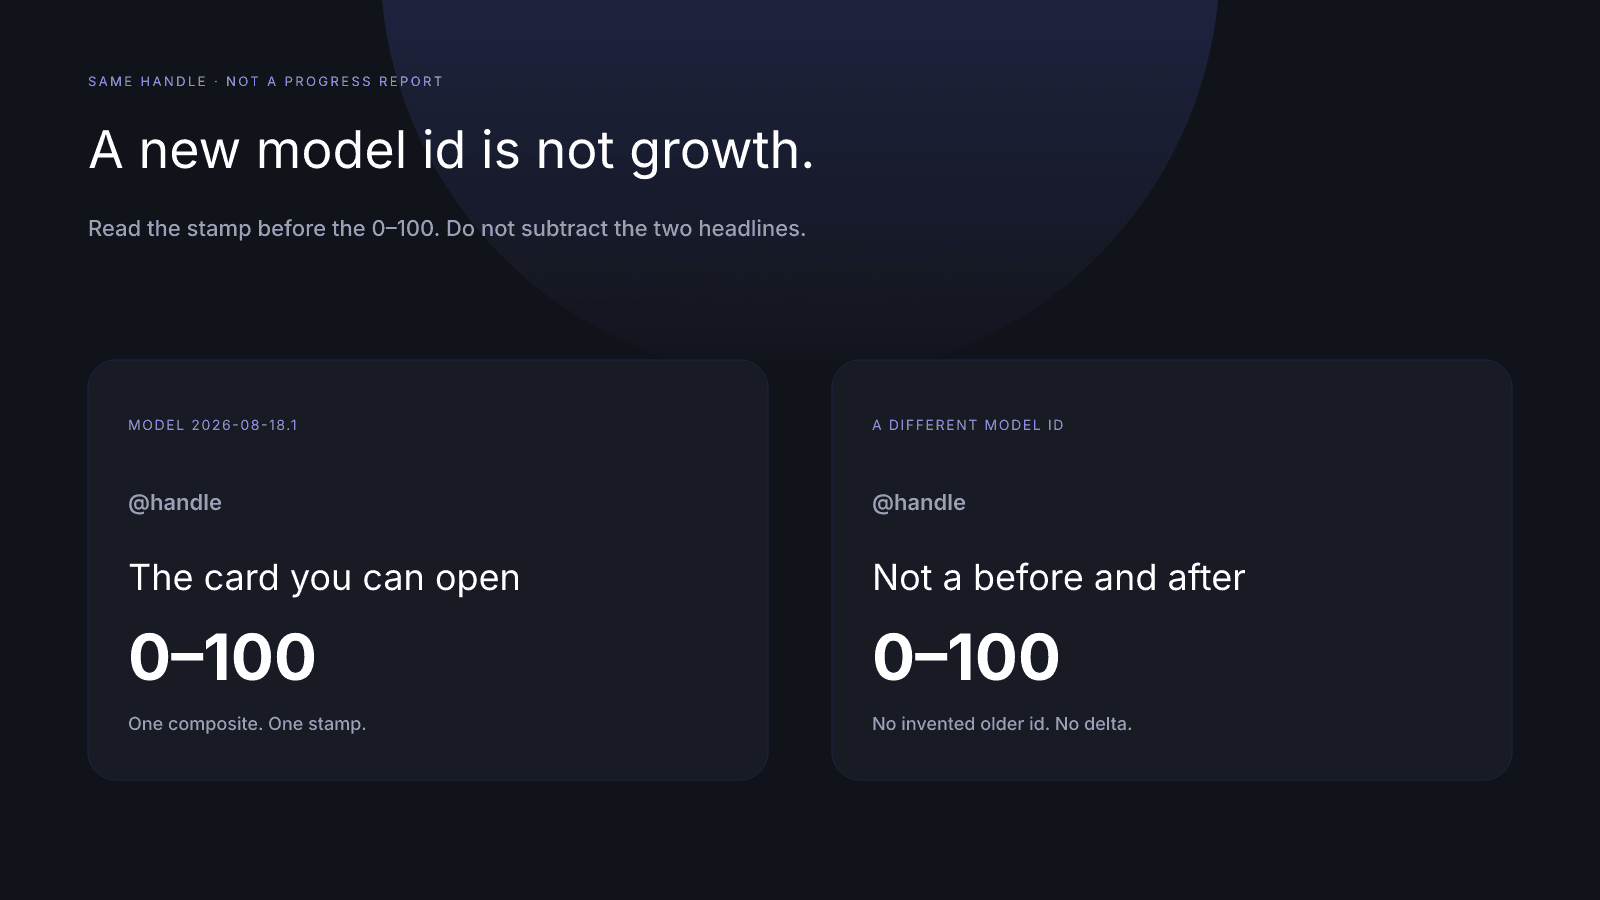
A different InfScore on the same creator can be a new model id, not progress. Compare version, coverage, and dashes before you read the 0–100 as growth.
Why Engagement Pods Usually Hurt Public Influence Scores
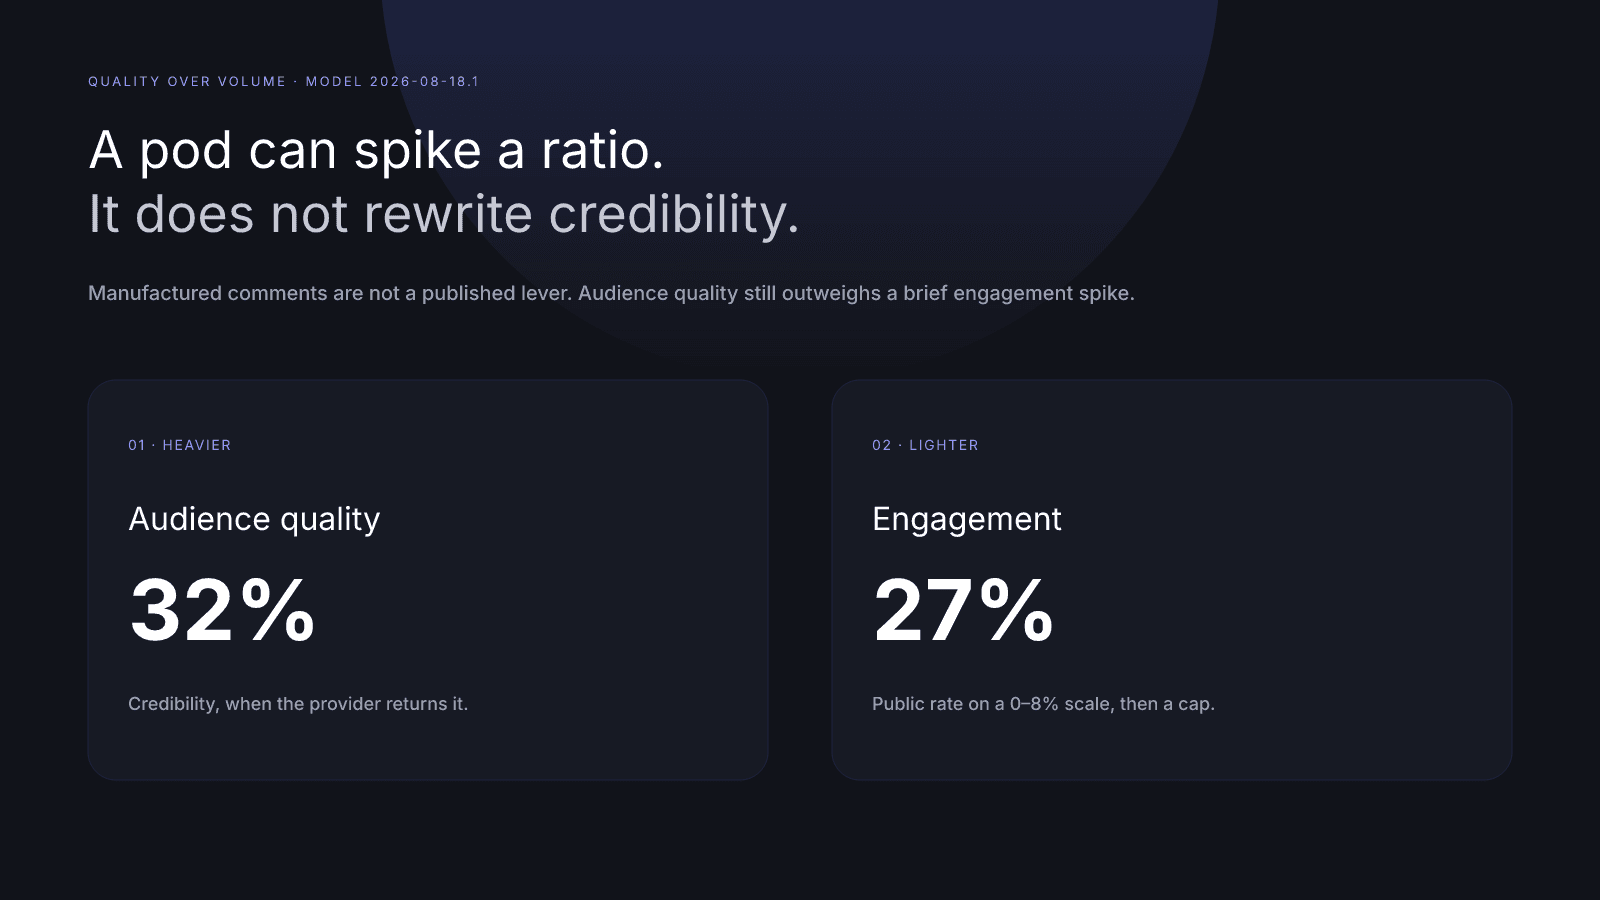
Engagement pods can briefly spike a public ratio and still weaken credibility. See how InfScore weighs engagement (27%) under audience quality (32%).
Ethical Ways to Improve Your InfScore
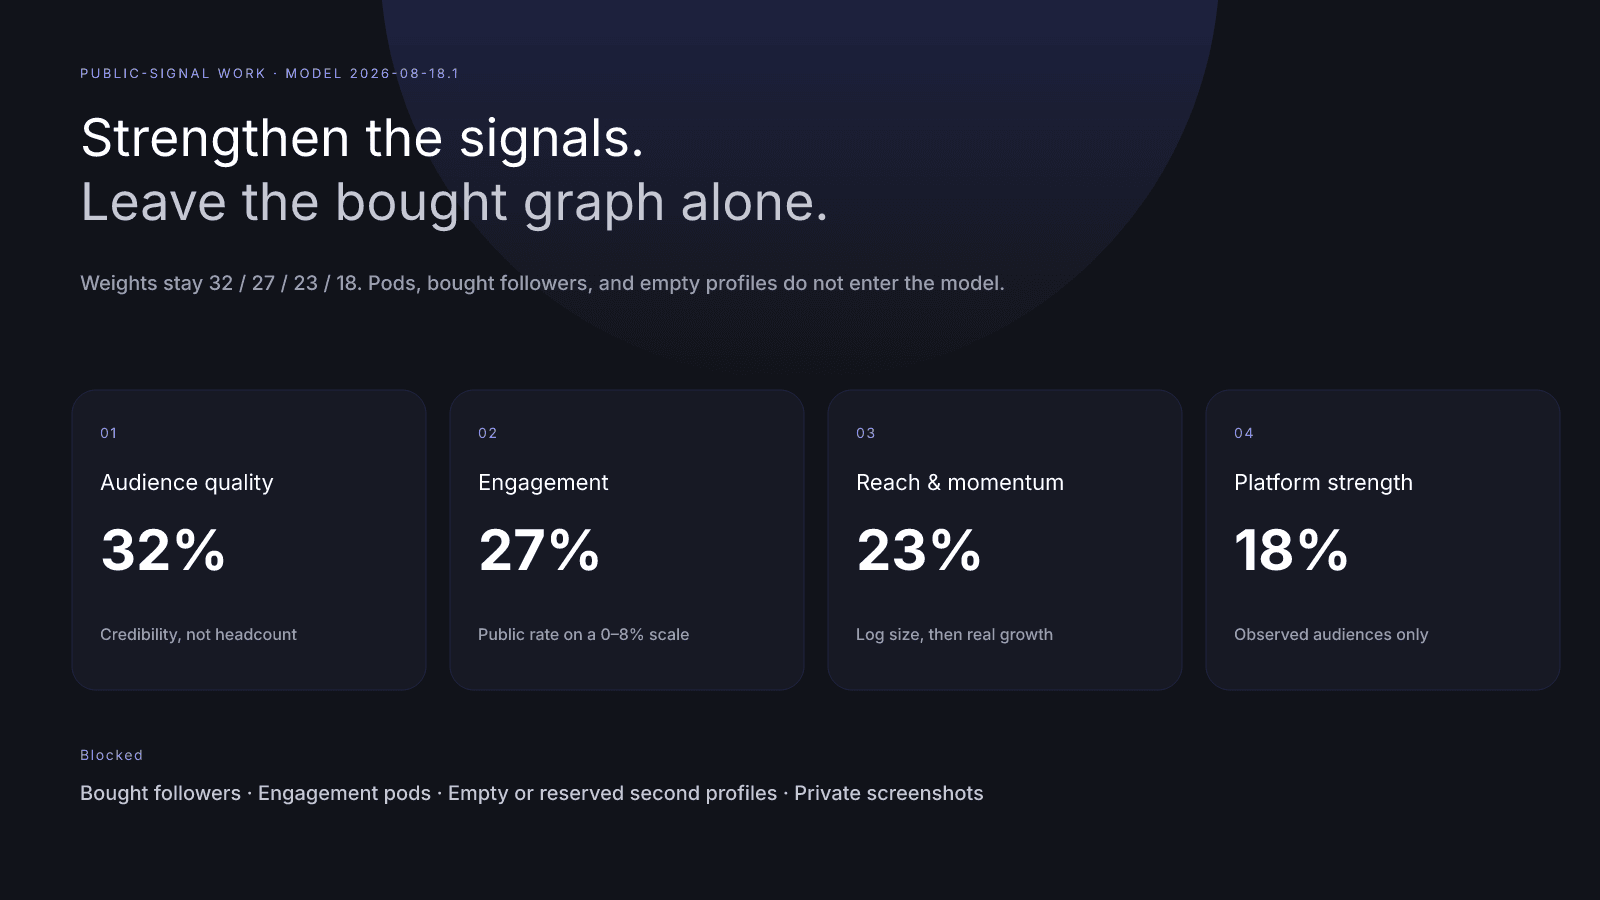
Improve InfScore with public-signal work only — audience quality, real engagement, reach, and observed platforms. No bought followers, pods, or empty second profiles.
Cross-Platform Creators
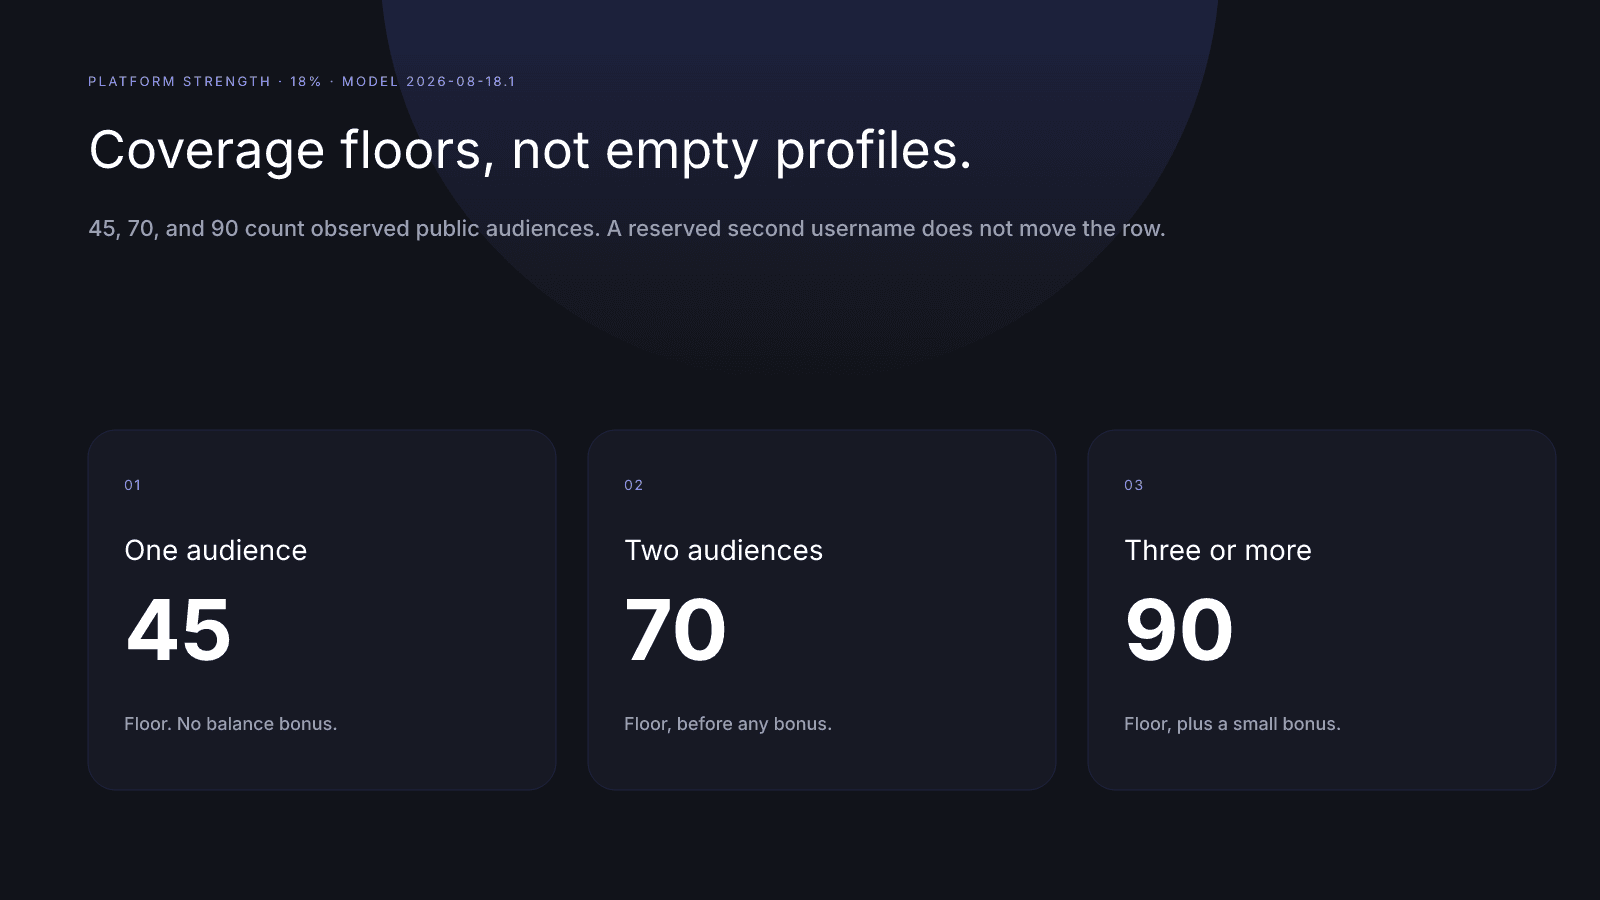
Platform strength is 18% of InfScore. See the 45 / 70 / 90 coverage floors — and why empty second profiles do not raise the score.
YouTube Momentum Signals
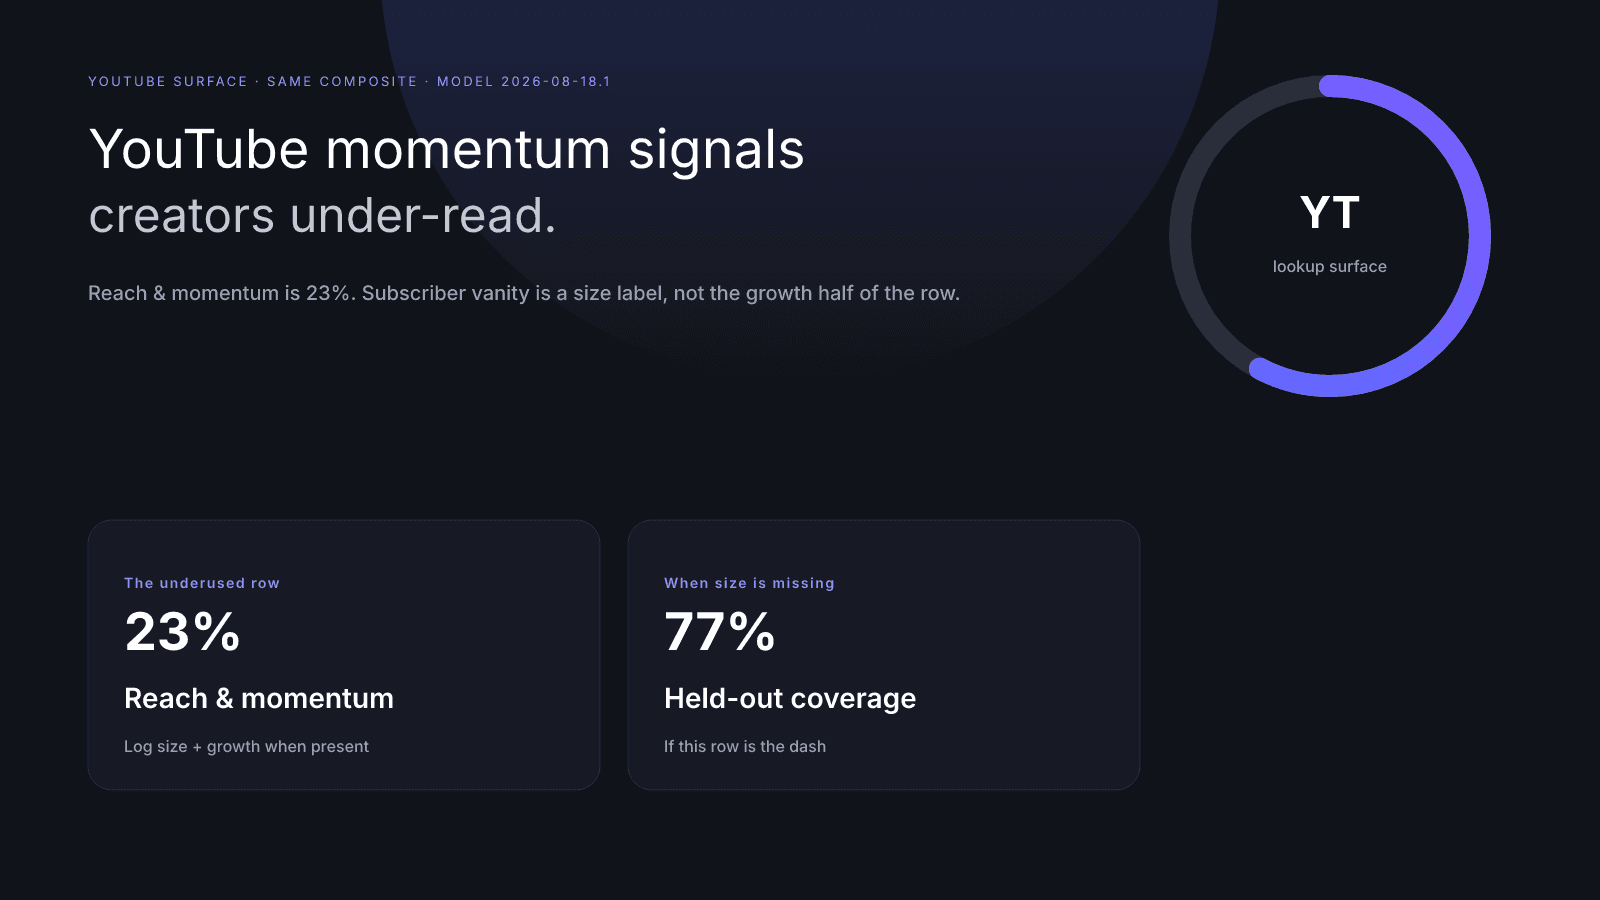
YouTube reach & momentum is 23% of InfScore. Learn which public growth and consistency signals creators underuse — and why subscriber vanity is not momentum.
TikTok Reach vs Engagement
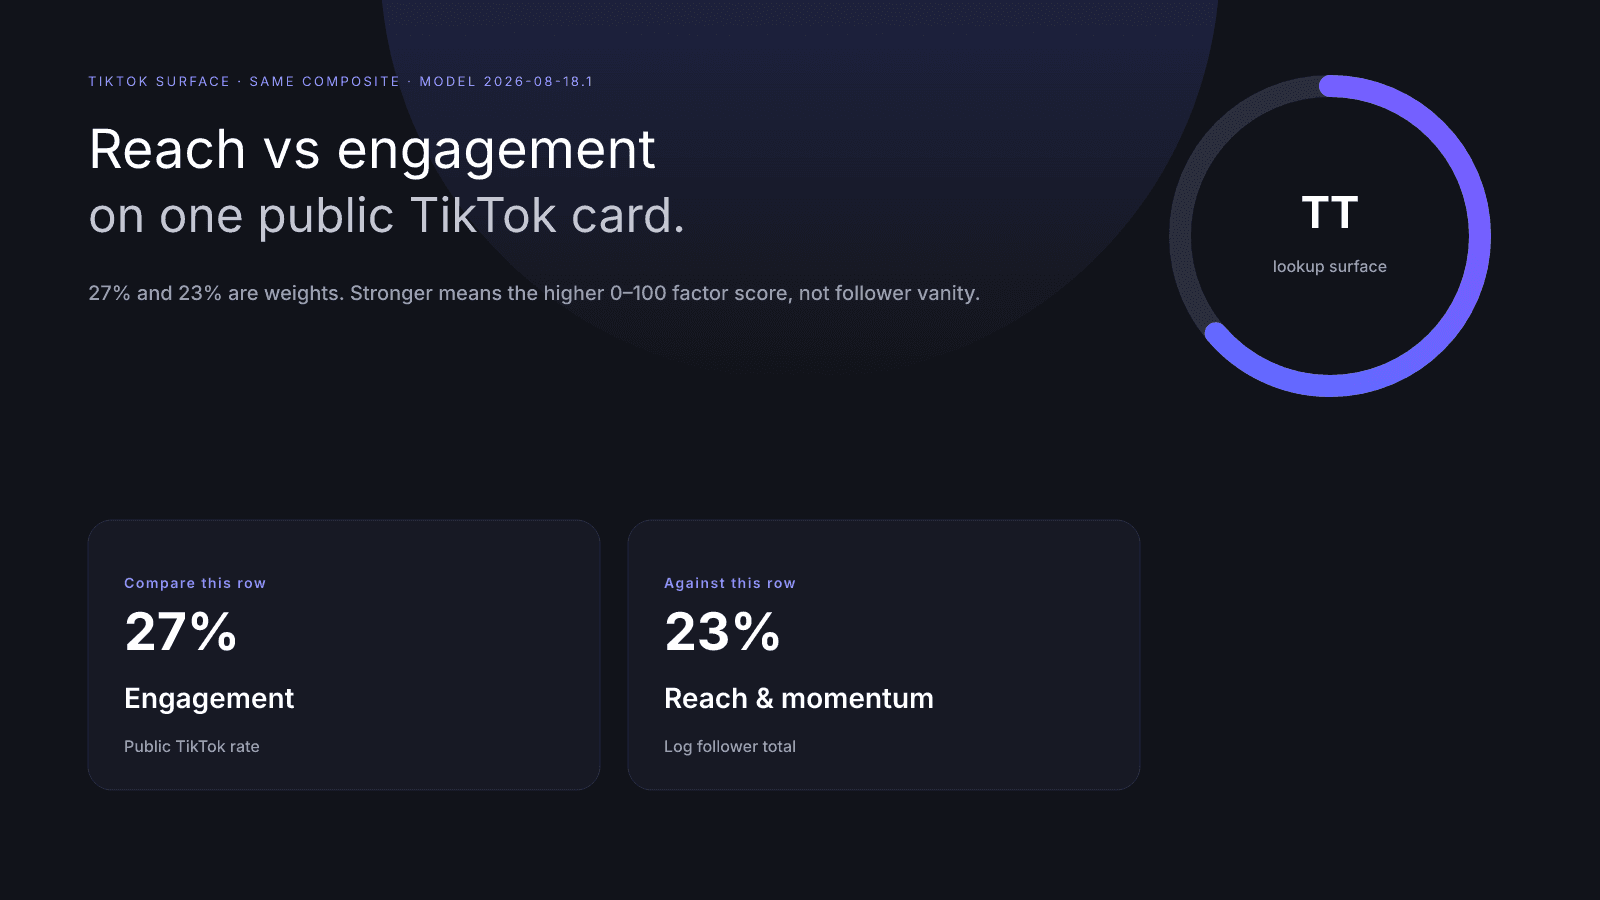
TikTok reach & momentum is 23% of InfScore; engagement is 27%. Learn how to compare the two public rows without vanity traps — and what a dash actually means.
Instagram InfScore Factors
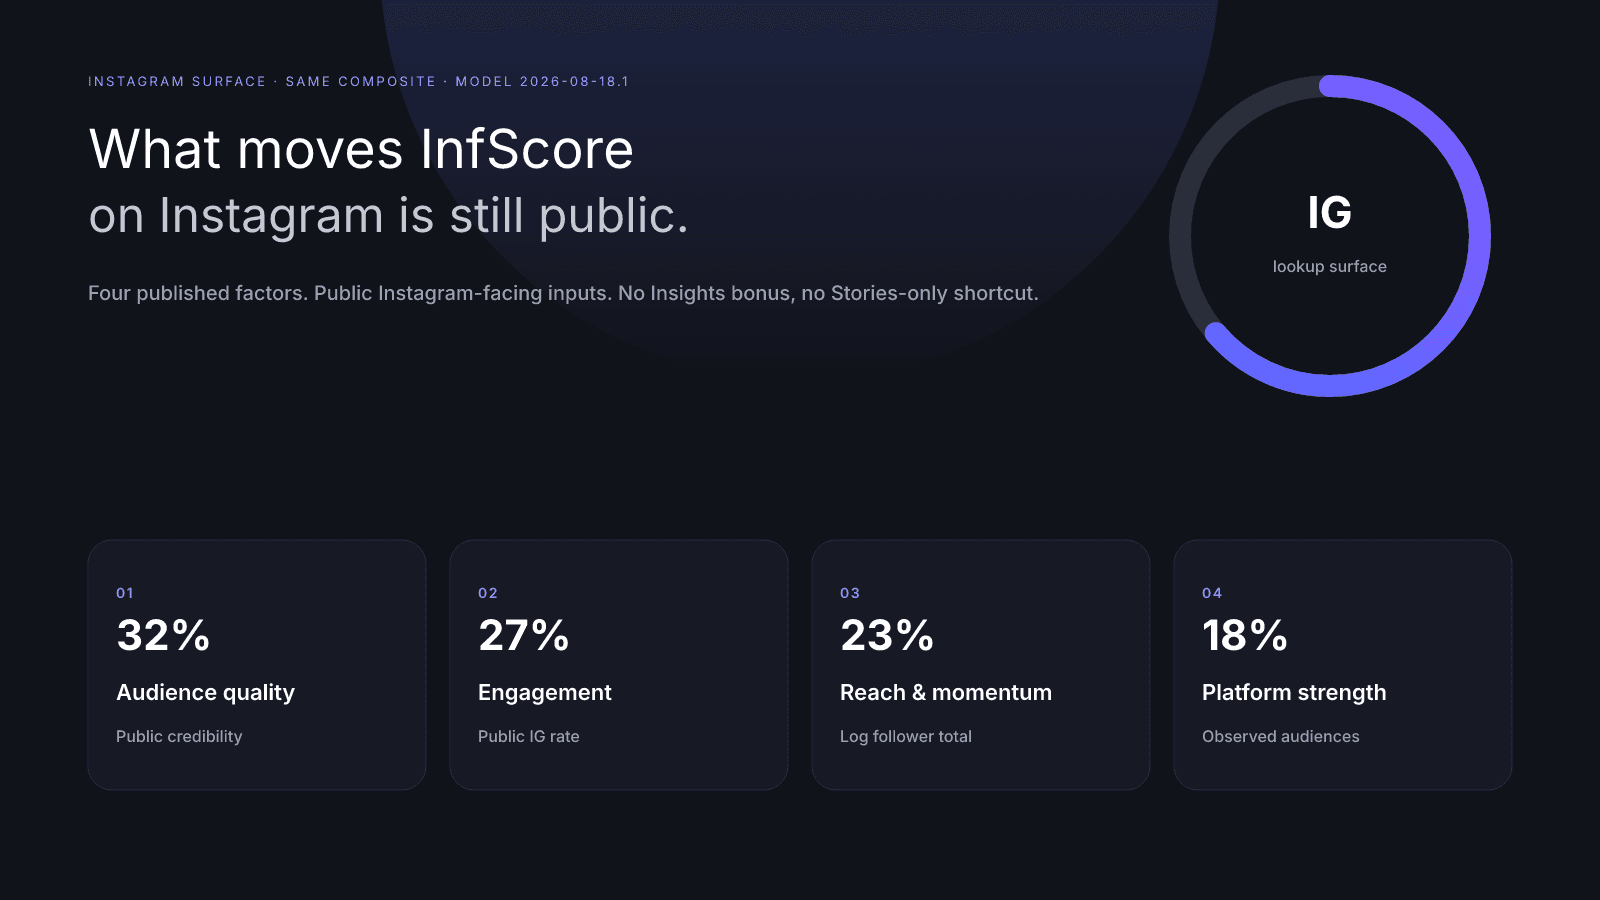
Which public Instagram signals move InfScore most? See how audience quality (32%), engagement (27%), reach & momentum (23%), and platform strength (18%) map to IG-facing inputs — without vanity traps.
Missing Data on Creator Metrics
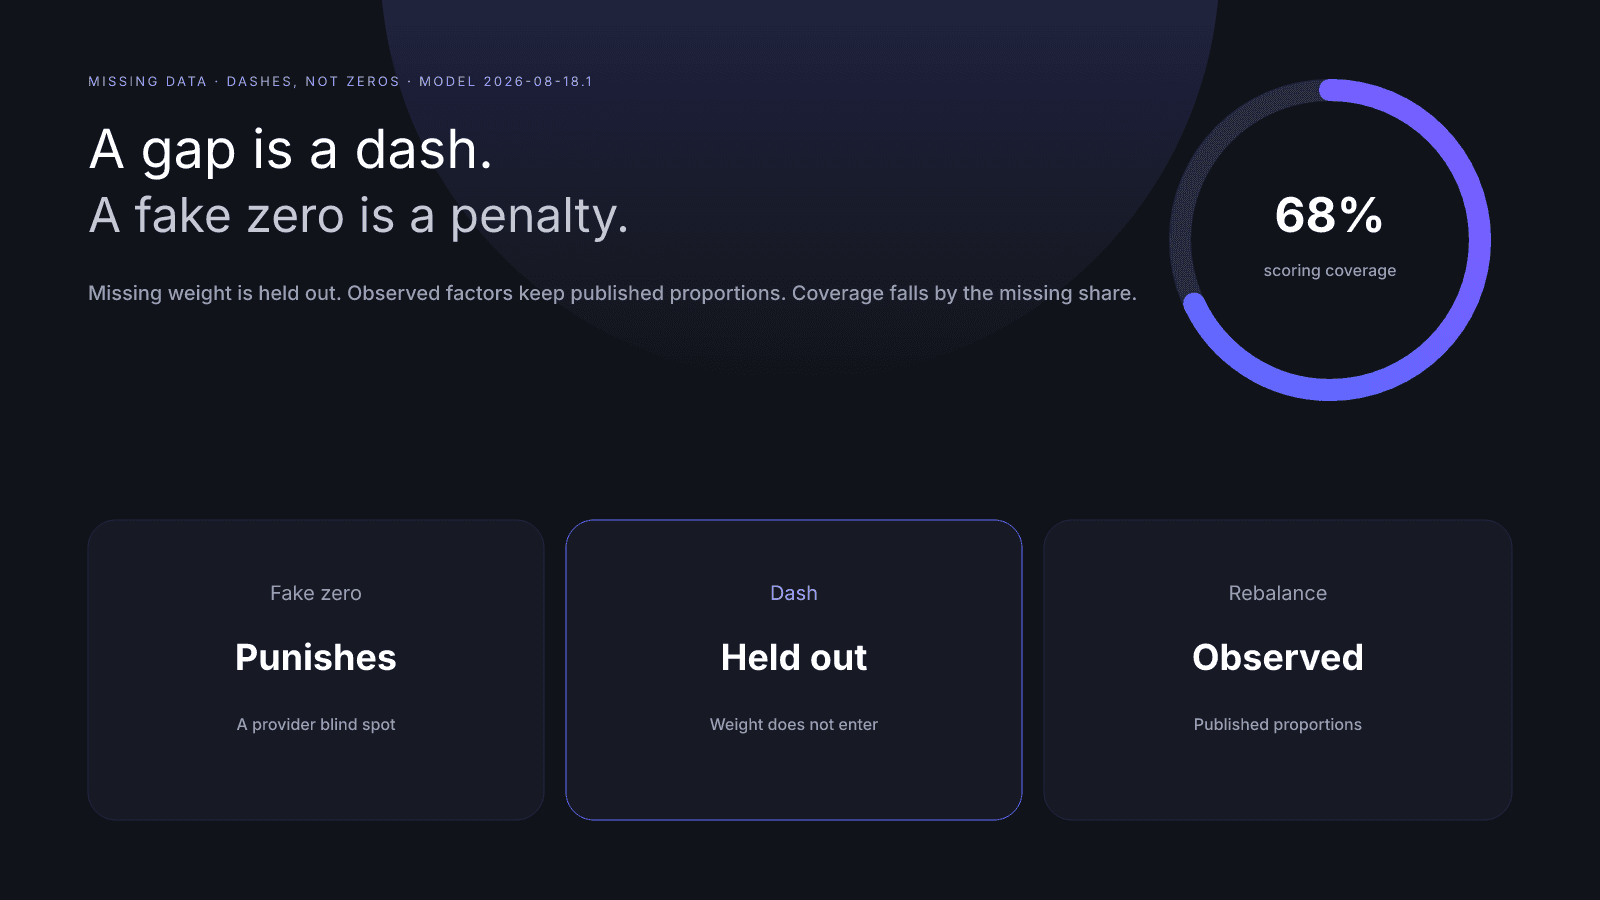
A missing creator metric is a gap, not a zero. Learn why fake zeros punish providers’ blind spots, how InfScore rebalances observed weights, and how to read scoring coverage honestly.
How to Read an Influencer Scorecard
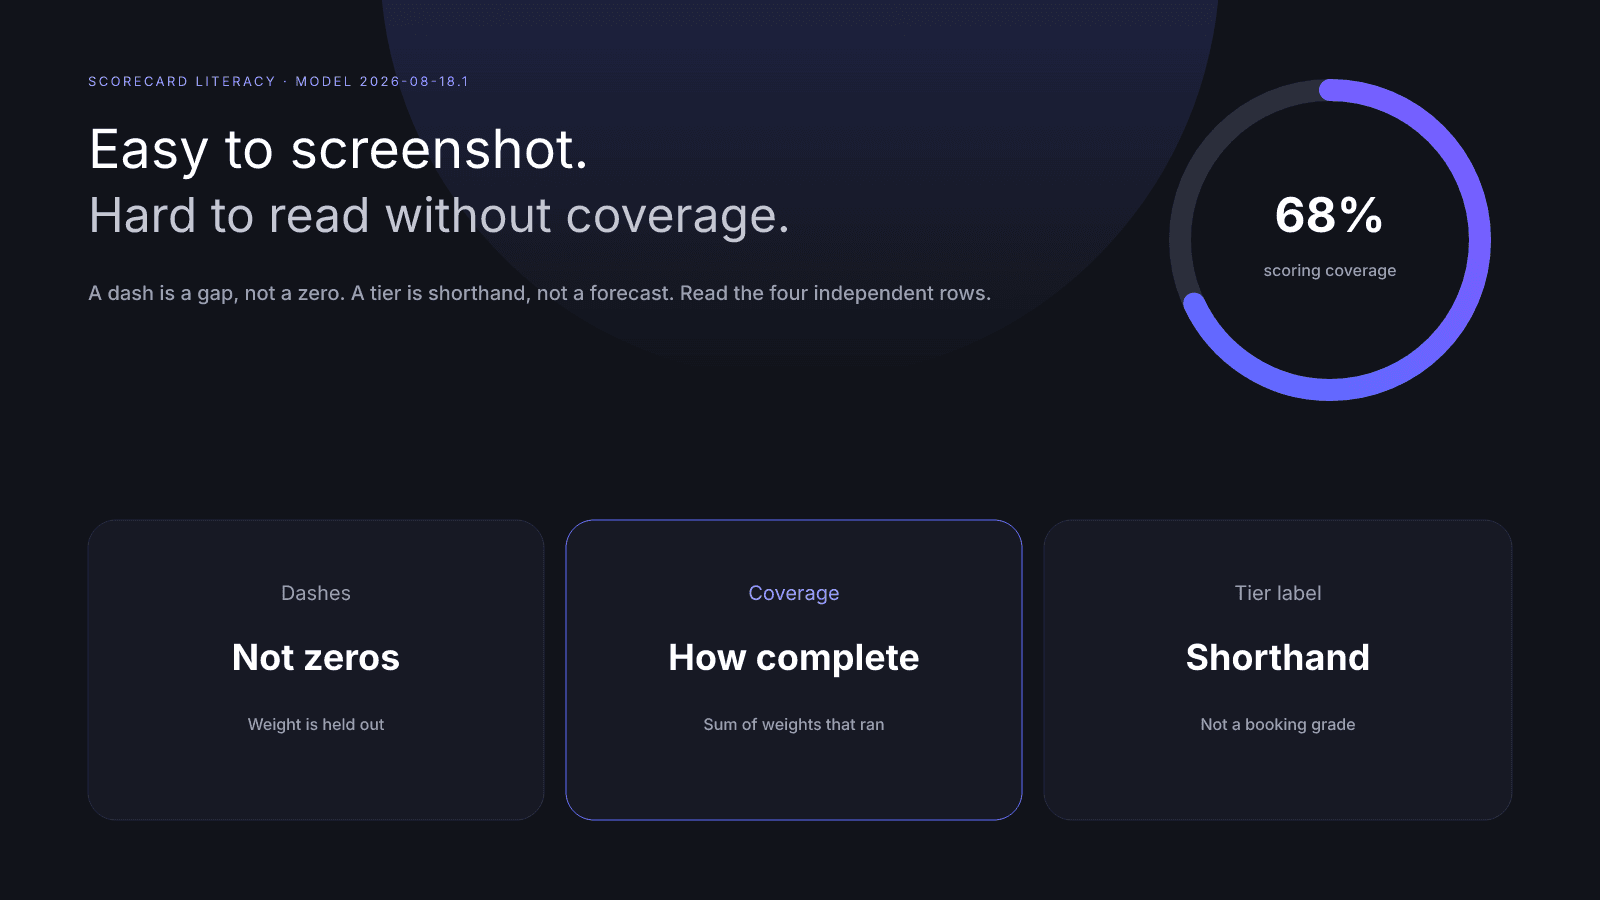
A scorecard is easy to screenshot and hard to read. Learn InfScore coverage, why dashes aren't zeros, what tier labels mean, and how to judge the four factors without vanity traps.
Audience Quality vs Follower Count
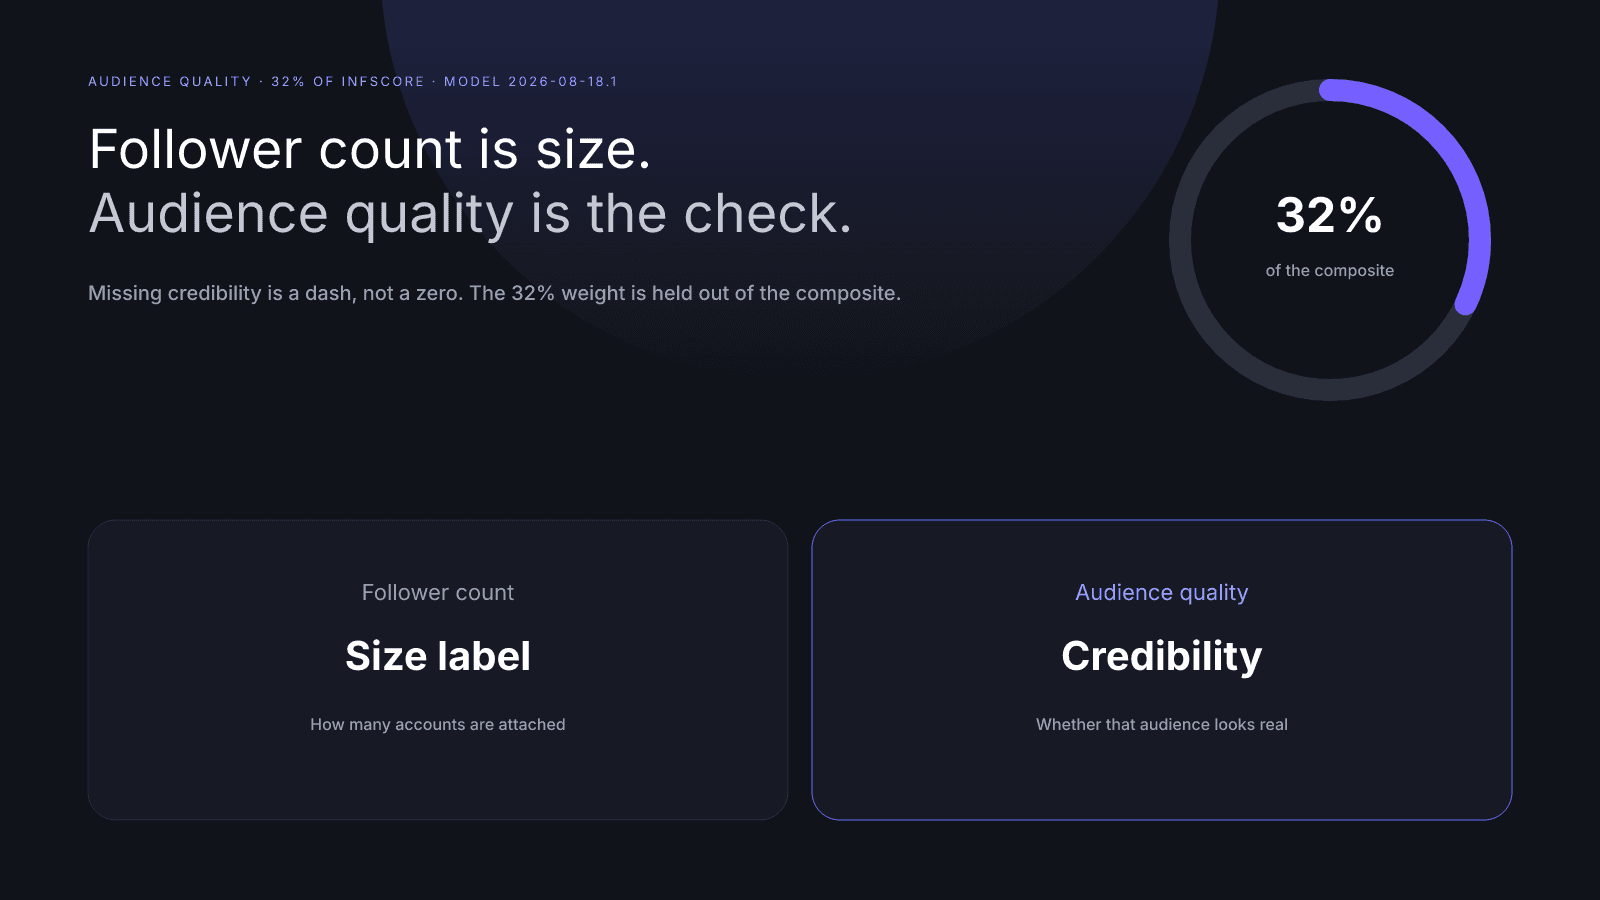
Follower count is size. Audience quality is credibility. InfScore weights AQ at 32% of the 0–100 score—why brands look past vanity headcounts, and why bought followers hurt.
What a Good Engagement Rate Looks Like in 2026
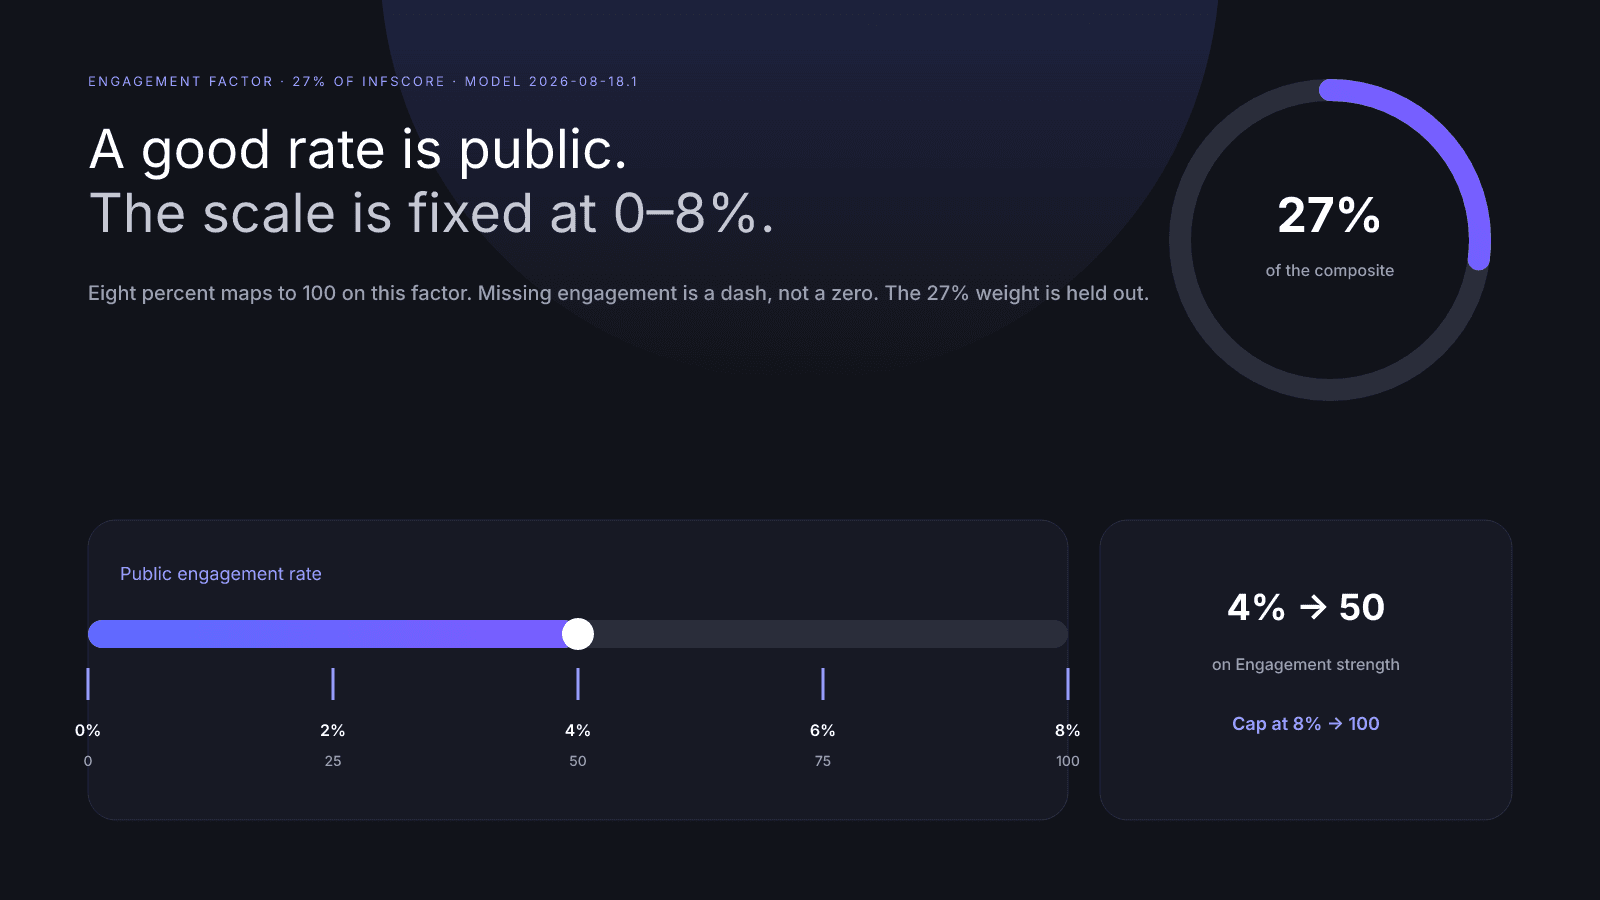
A good engagement rate in 2026 is contextual—not a single magic %. See how InfScore maps public ER onto a fixed 0–8% scale (27% of the score) and how to read it without vanity metrics.
How to Measure Influencer Performance
Learn how to measure influencer performance with audience quality, engagement, reach, and platform signals — and how InfScore rates creators 0–100.