Influencer Follower Growth: What 12-Month Growth Does to a Score
Influencer follower growth is 30% of one InfScore factor. See the 12-month momentum formula, how negative growth scores, and why missing isn't 0%.
This versioned composite uses only available public signals. Missing factors stay unavailable and their weight is rebalanced across observed factors. It is not a percentile, price estimate, or guarantee of campaign results. Model 2026-08-18.1.
On InfScore, influencer follower growth is the requested app's 12-month follower growth figure, and it feeds momentum, which is 30% of the Reach & momentum factor. On model 2026-08-18.1 the weights are audience quality 32%, engagement strength 27%, reach and momentum 23%, and platform strength 18%. Missing growth is not 0%: with no figure, the row is reach alone. It is not a percentile, price estimate, or guarantee of campaign results.
What follower growth means on InfScore
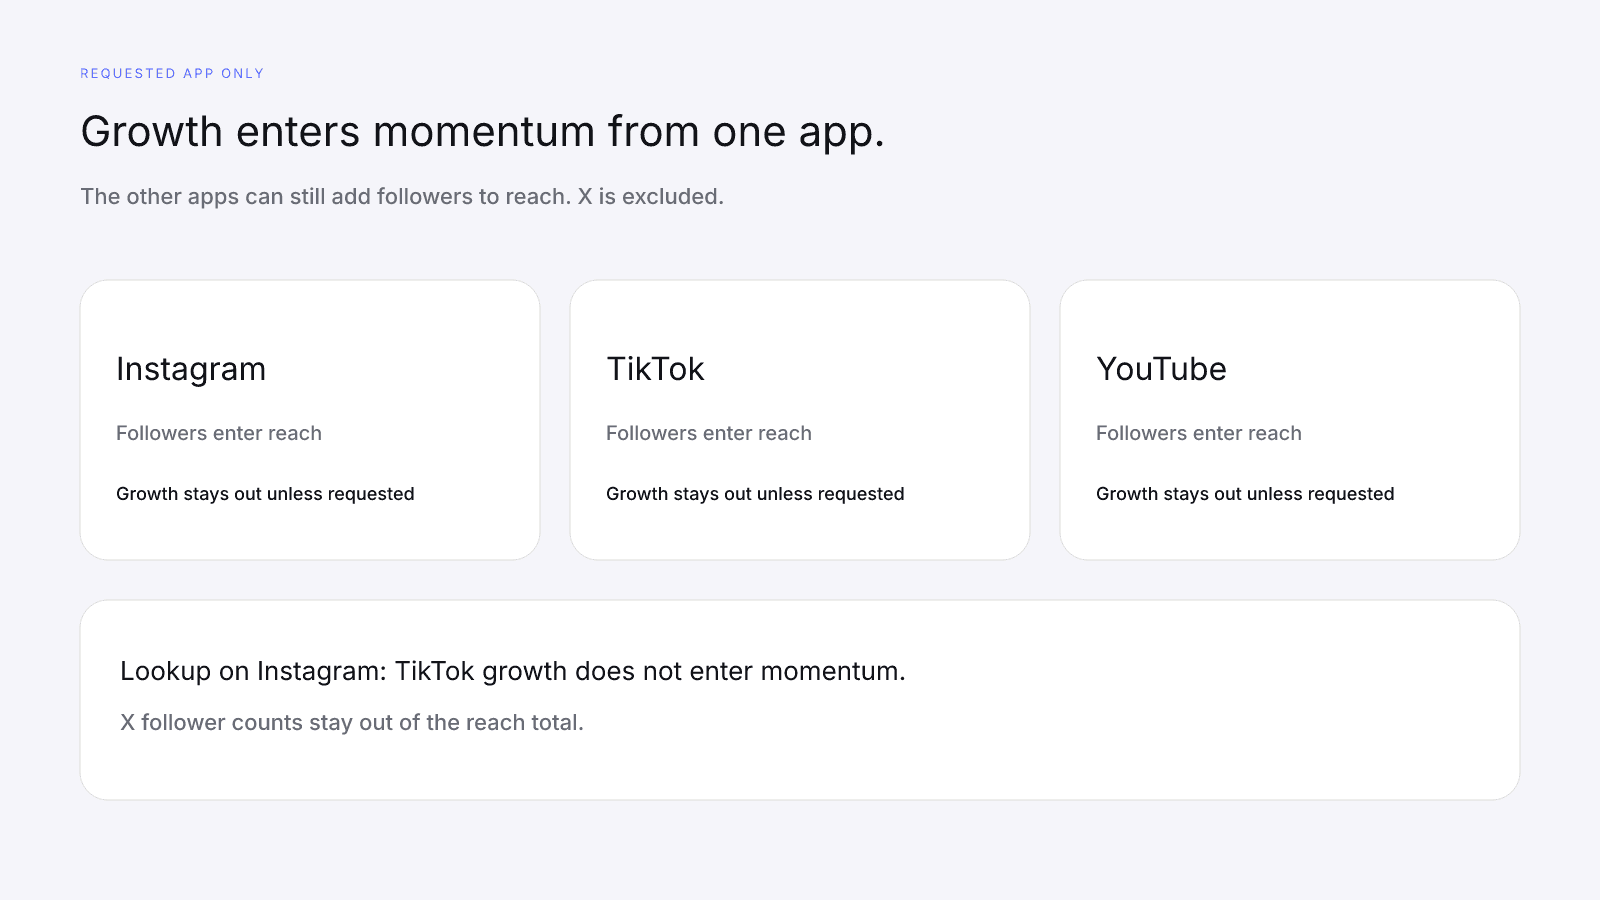
The figure is the requested app's 12-month follower growth, from the provider's data, and the requested app is the platform the lookup asked for. Growth on the creator's other apps does not enter momentum. Their follower counts still enter reach: the total adds Instagram, TikTok, and YouTube, and X is left out of the sum. So on an Instagram lookup, a TikTok gain stays out of momentum even if those followers moved the reach component. Instagram vs TikTok vs YouTube: Which Platform Fits Your Campaign? covers how the requested app is chosen.
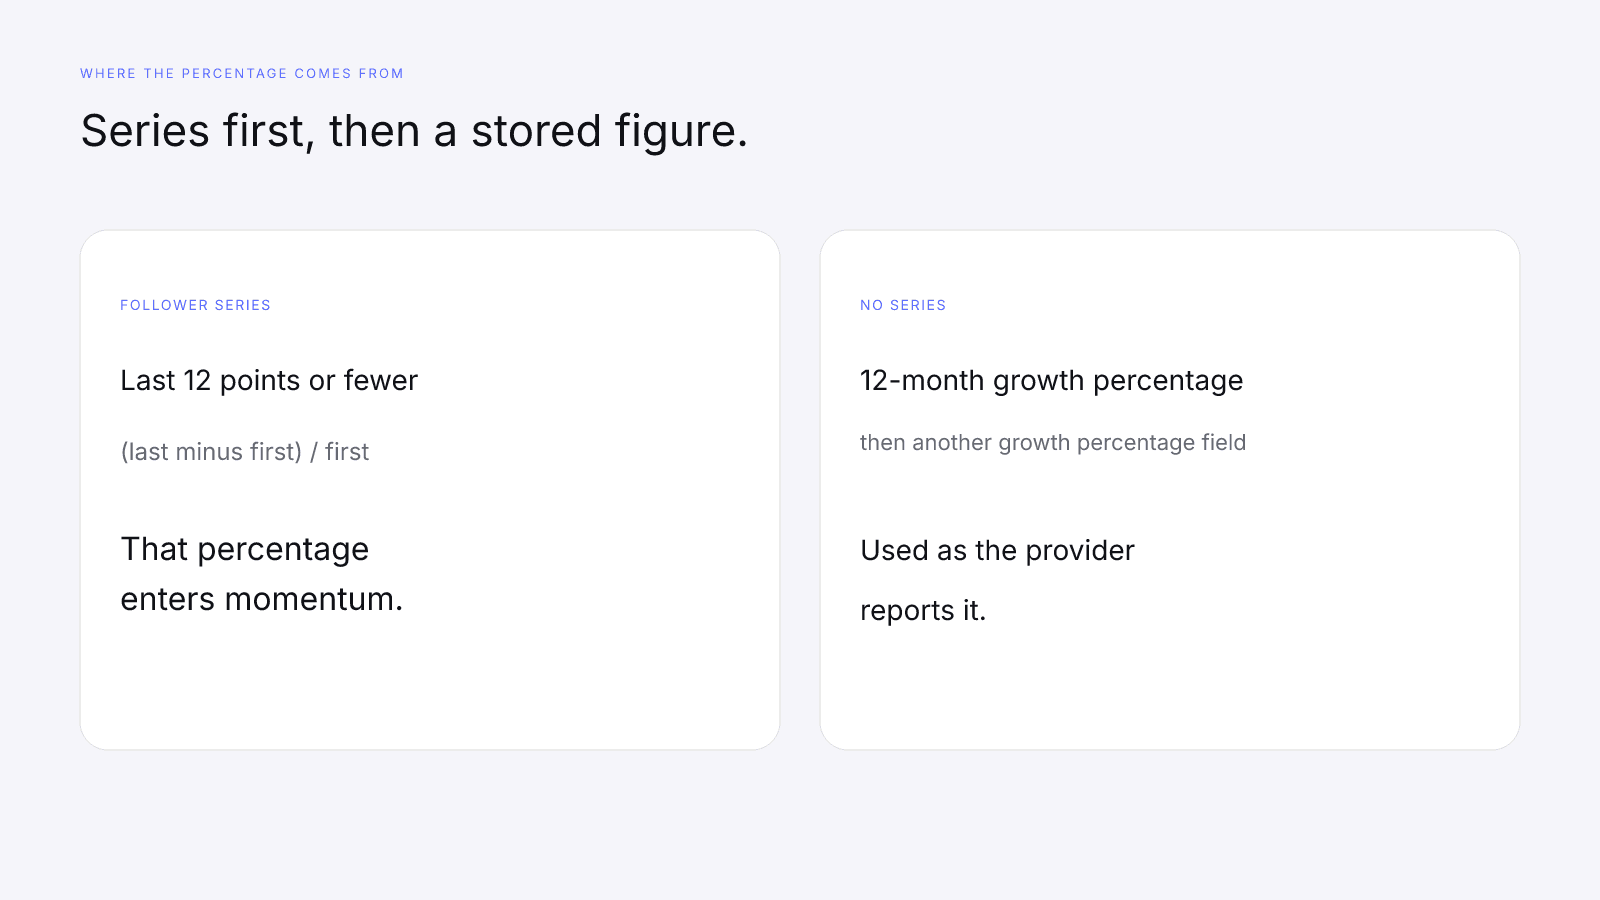
When the provider sends a follower series, InfScore takes the last 12 points or fewer and computes (last minus first) divided by first, which turns the series into the single percentage that enters momentum. Without a series, it uses the provider's 12-month growth percentage, and after that it falls back to another growth percentage field. So the figure is not always a percentage the provider already computed, and the window is whatever the provider's data covers.
Momentum uses that growth figure and nothing else. Engagement, audience quality, and platform strength are separate factors, each with its own inputs.
How growth becomes momentum
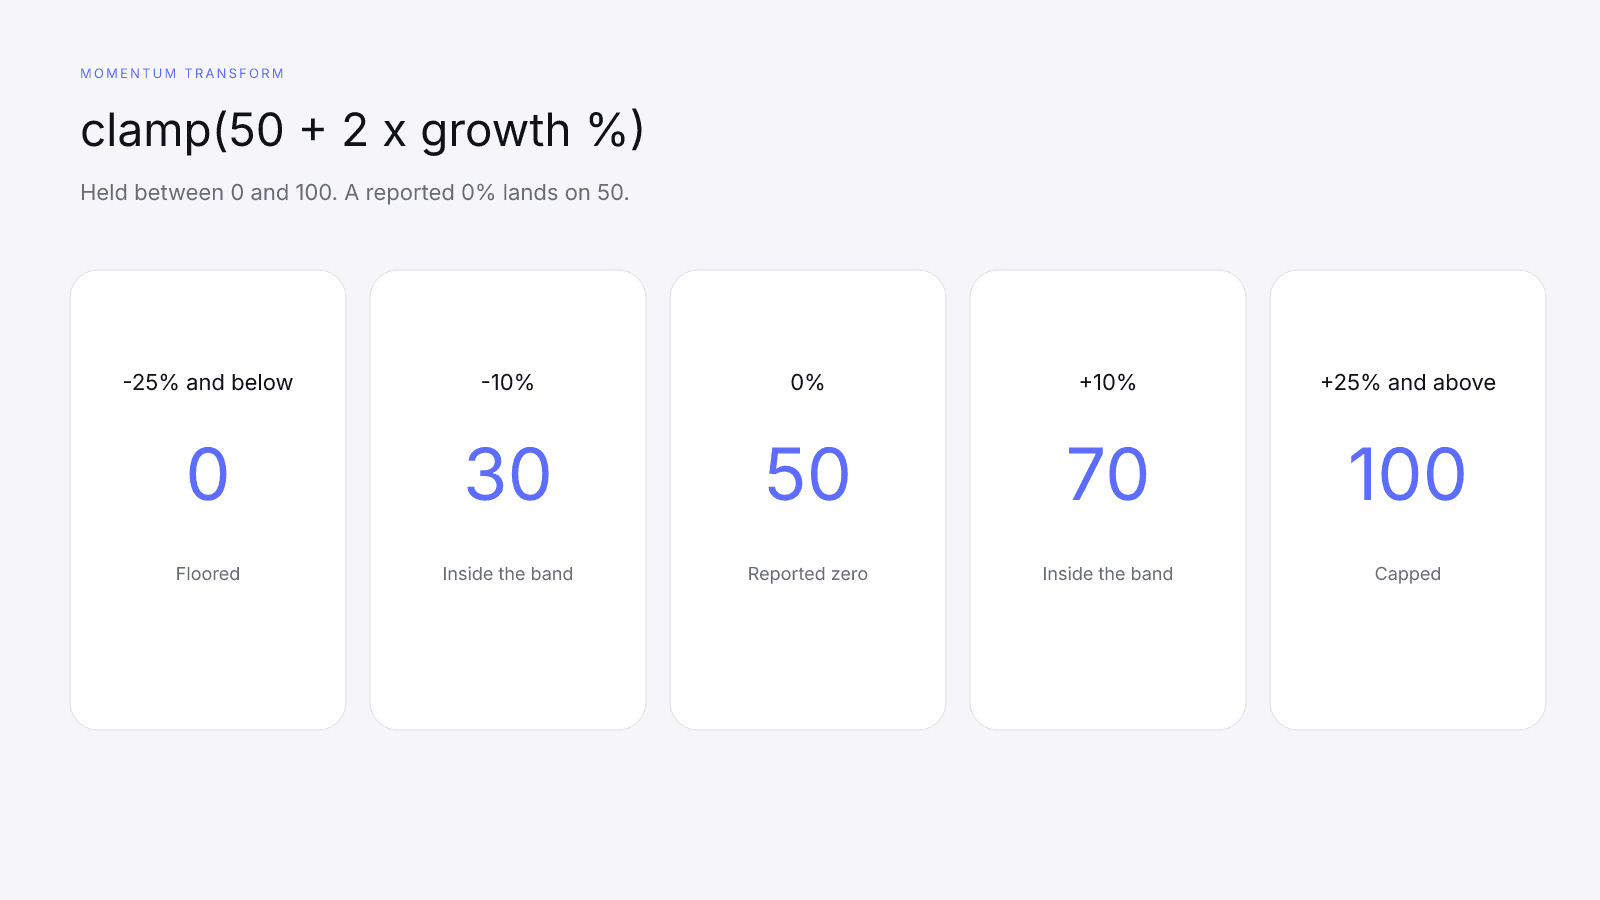
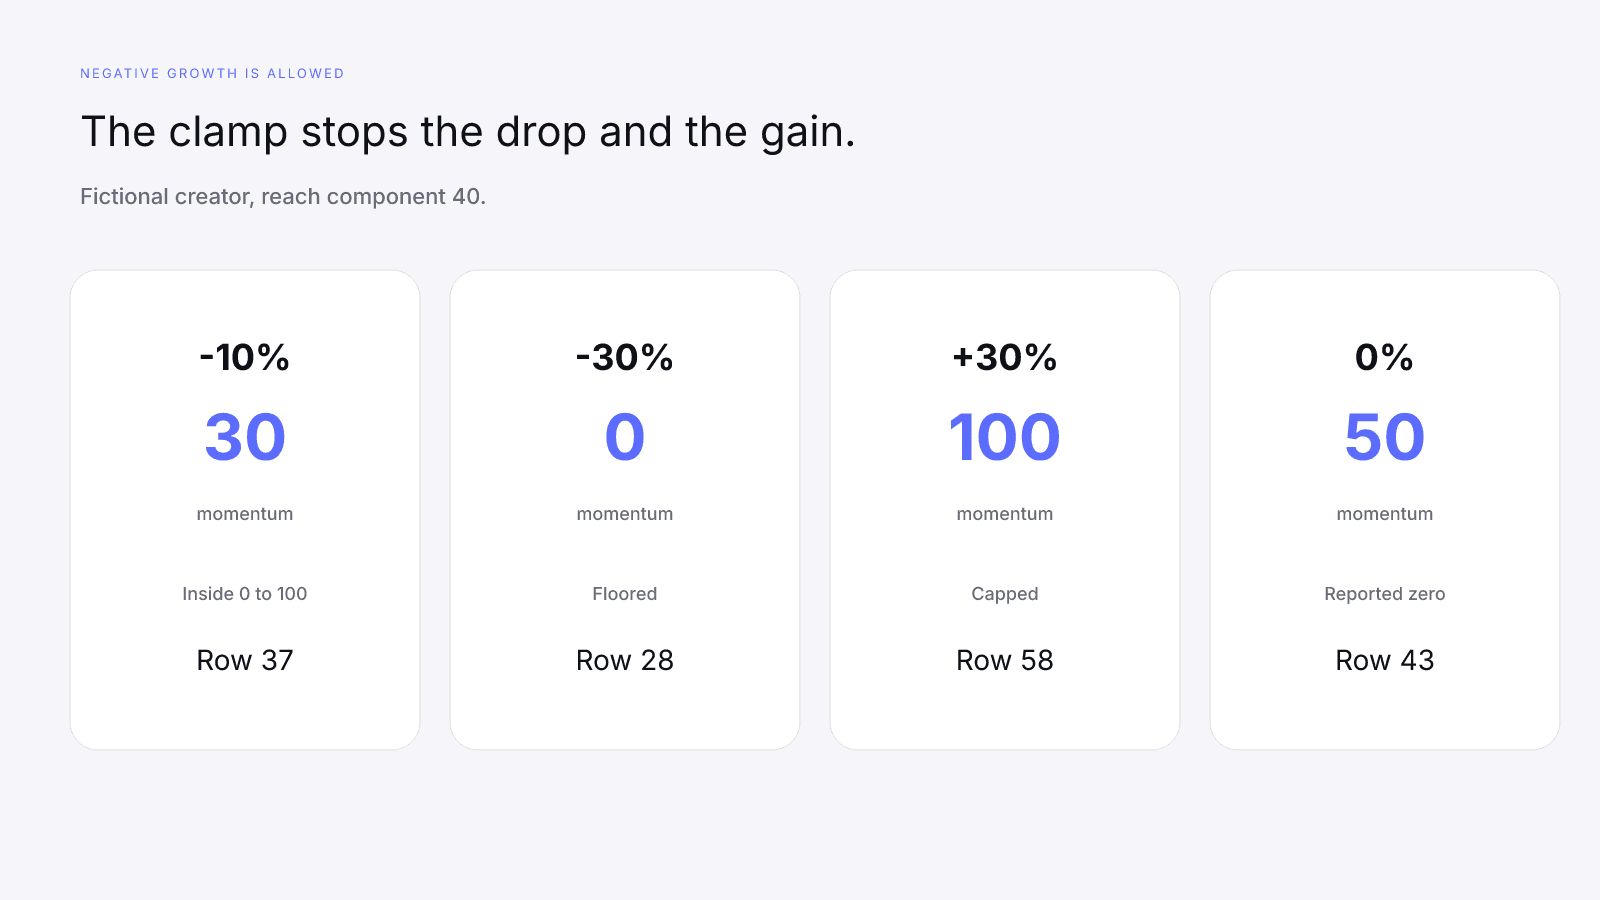
Momentum is clamp(50 + 2 × the growth percentage), held between 0 and 100. A reported 0% lands on 50, anything at or above +25% lands on 100, and anything at or below -25% lands on 0. In between, each point of growth moves momentum by 2, so +10% is 70 and -10% is 30.
When there's a growth figure, the row is round(0.7 × reach + 0.3 × momentum). With no growth figure, that step is skipped and the row is round(reach). On model 2026-08-18.1, growth is 30% of a 23% factor: momentum is 30% of the Reach & momentum row, that row is 23% of the composite, and reach makes up the other 70% of the row.
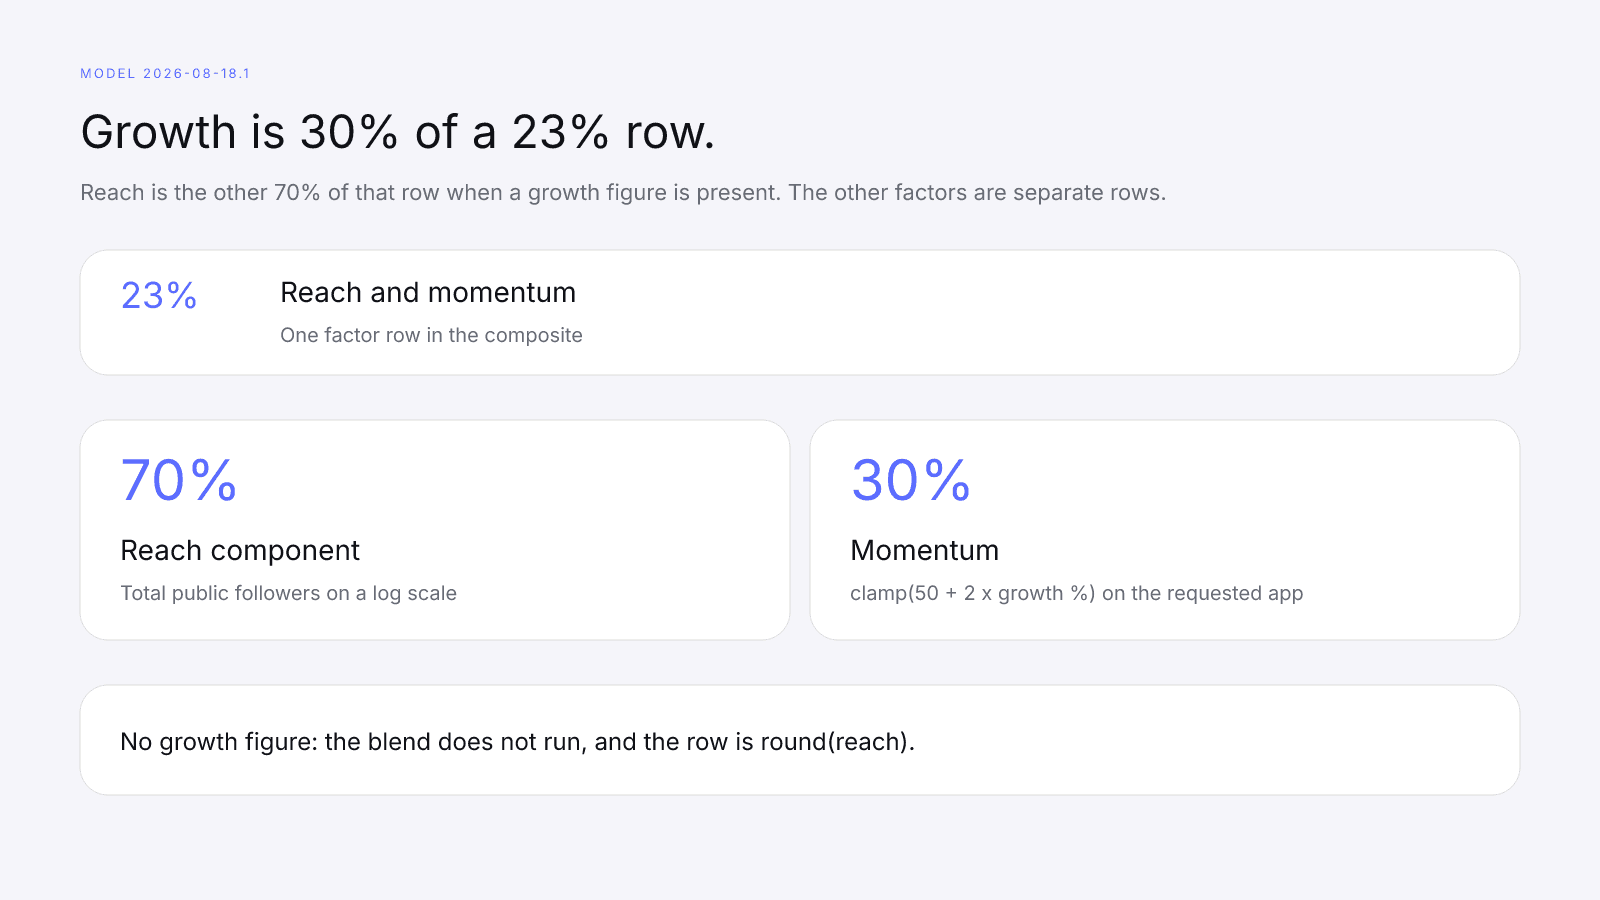
Reach reads total public followers on a log scale: clamp((log10(max(1000, followers)) - 3) / 5 × 100). What happens at the bottom of that scale is covered in Nano Influencers: What a Small Account's Score Can and Can't Tell You.
Whether growth lifts or lowers the row depends on where momentum sits against the reach component: the blend lands above reach when momentum is higher, and below it when momentum is lower. That's why a reported 0%, which sets momentum to 50, lifts a reach component under 50 and lowers one over 50.
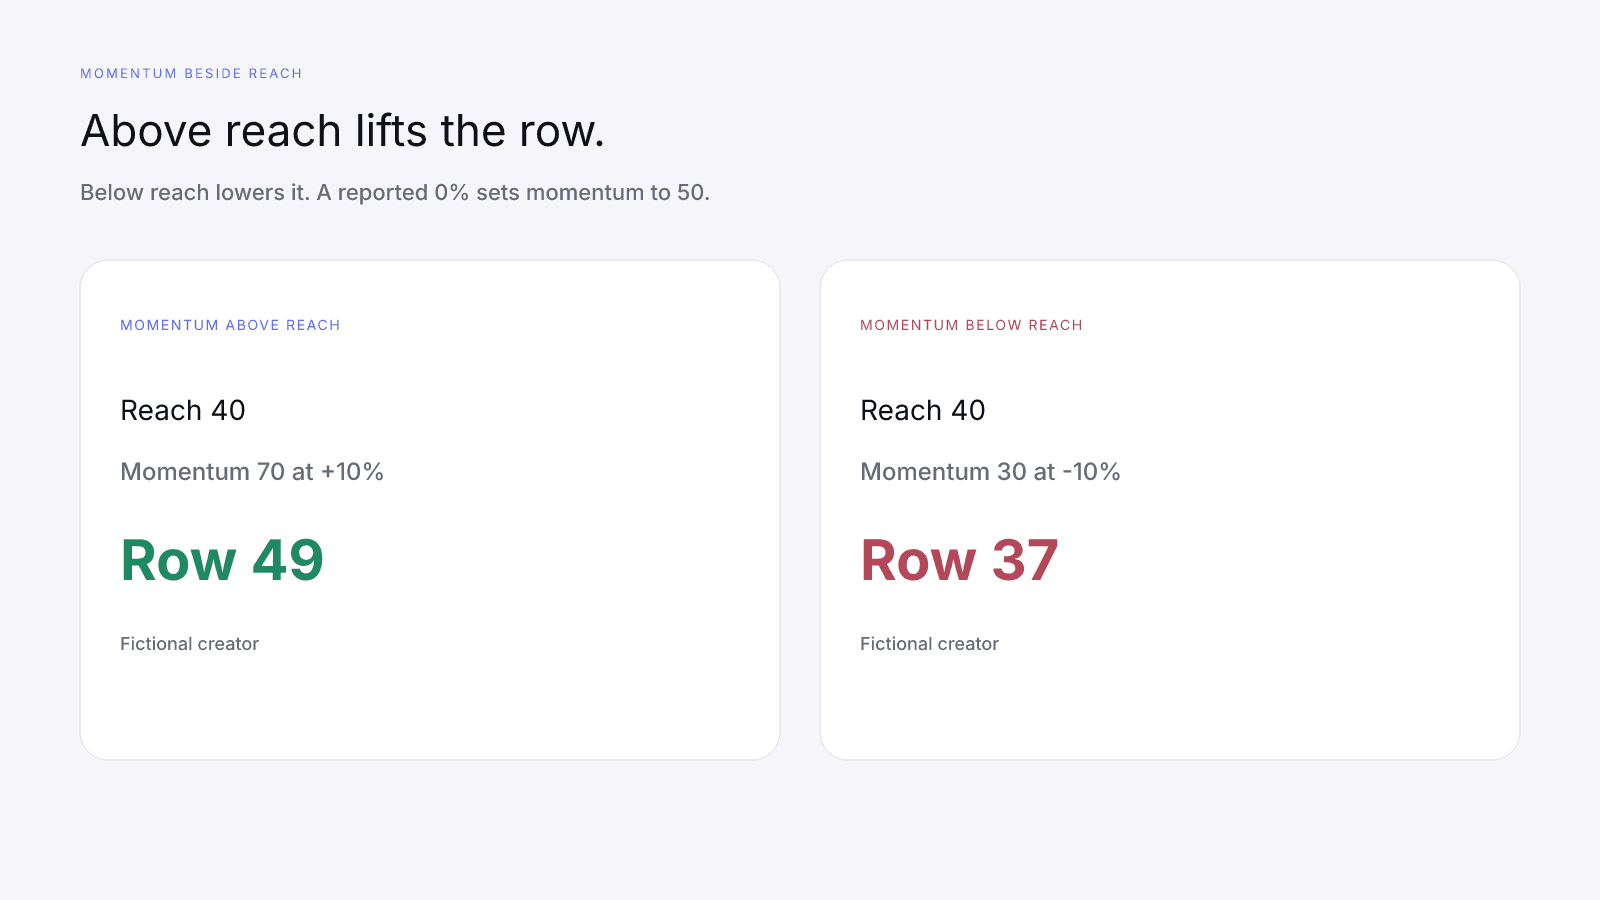
YouTube Momentum Signals Creators Underuse walks through the same blend for a YouTube lookup, and the formula doesn't change with the app. A new model id can change these numbers, and Comparing InfScore Across Model Versions explains how.
A worked example with a fictional creator
Every reading below is labelled fictional. Treat it as a worked card, not a public profile.
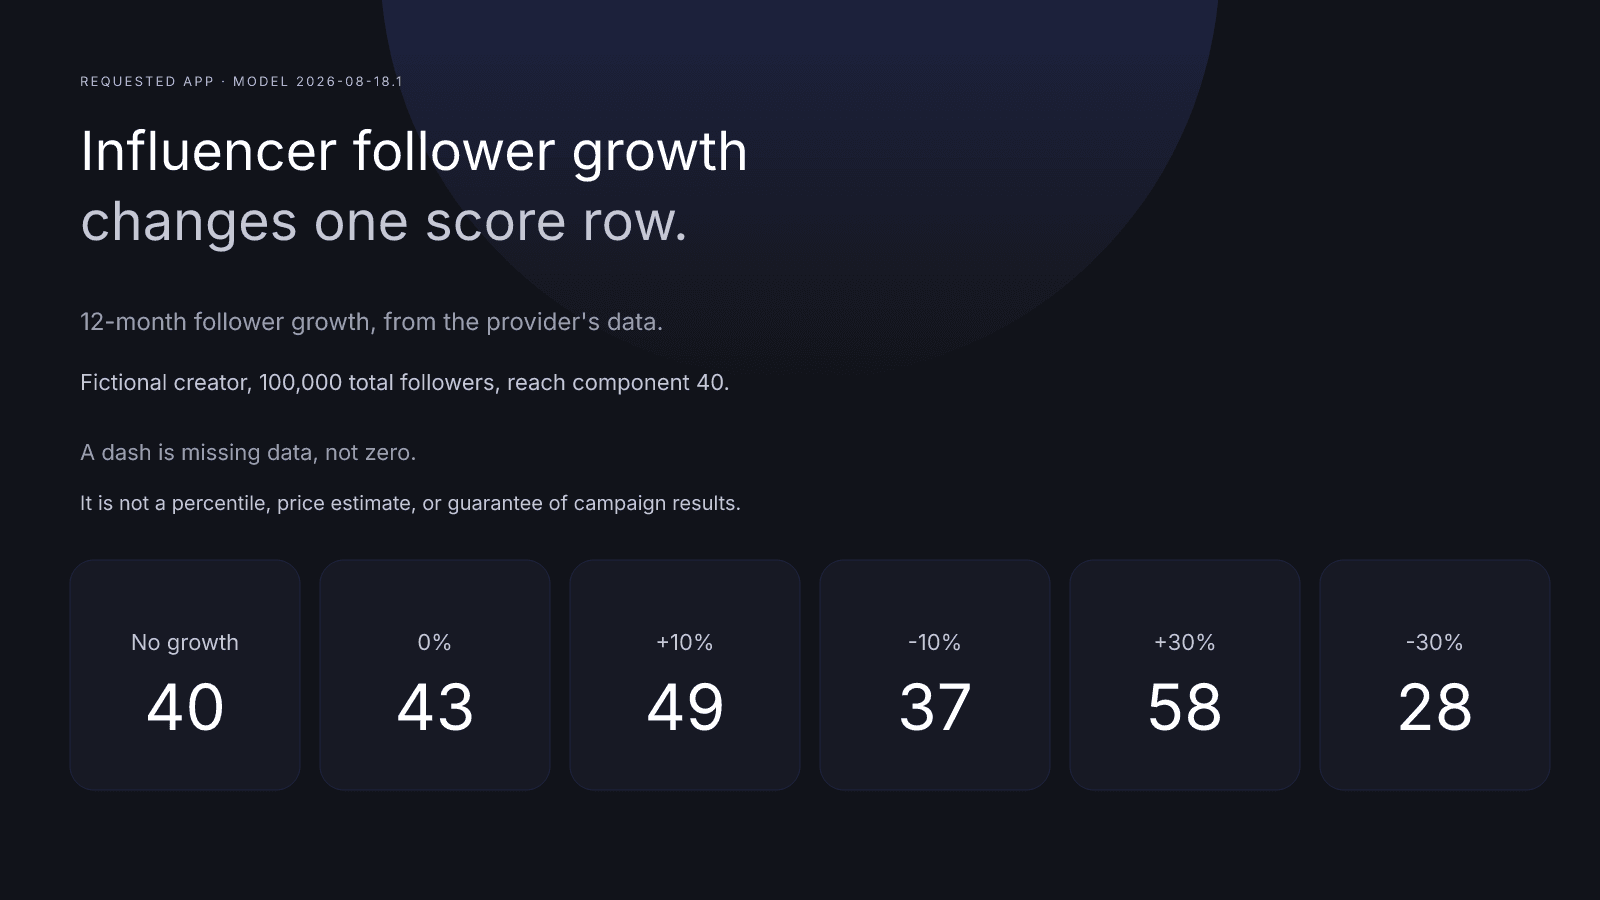
Fictional creator, 100,000 total followers, reach component 40. log10(100,000) is 5, and (5 - 3) / 5 × 100 is 40. Only the growth figure changes from line to line.
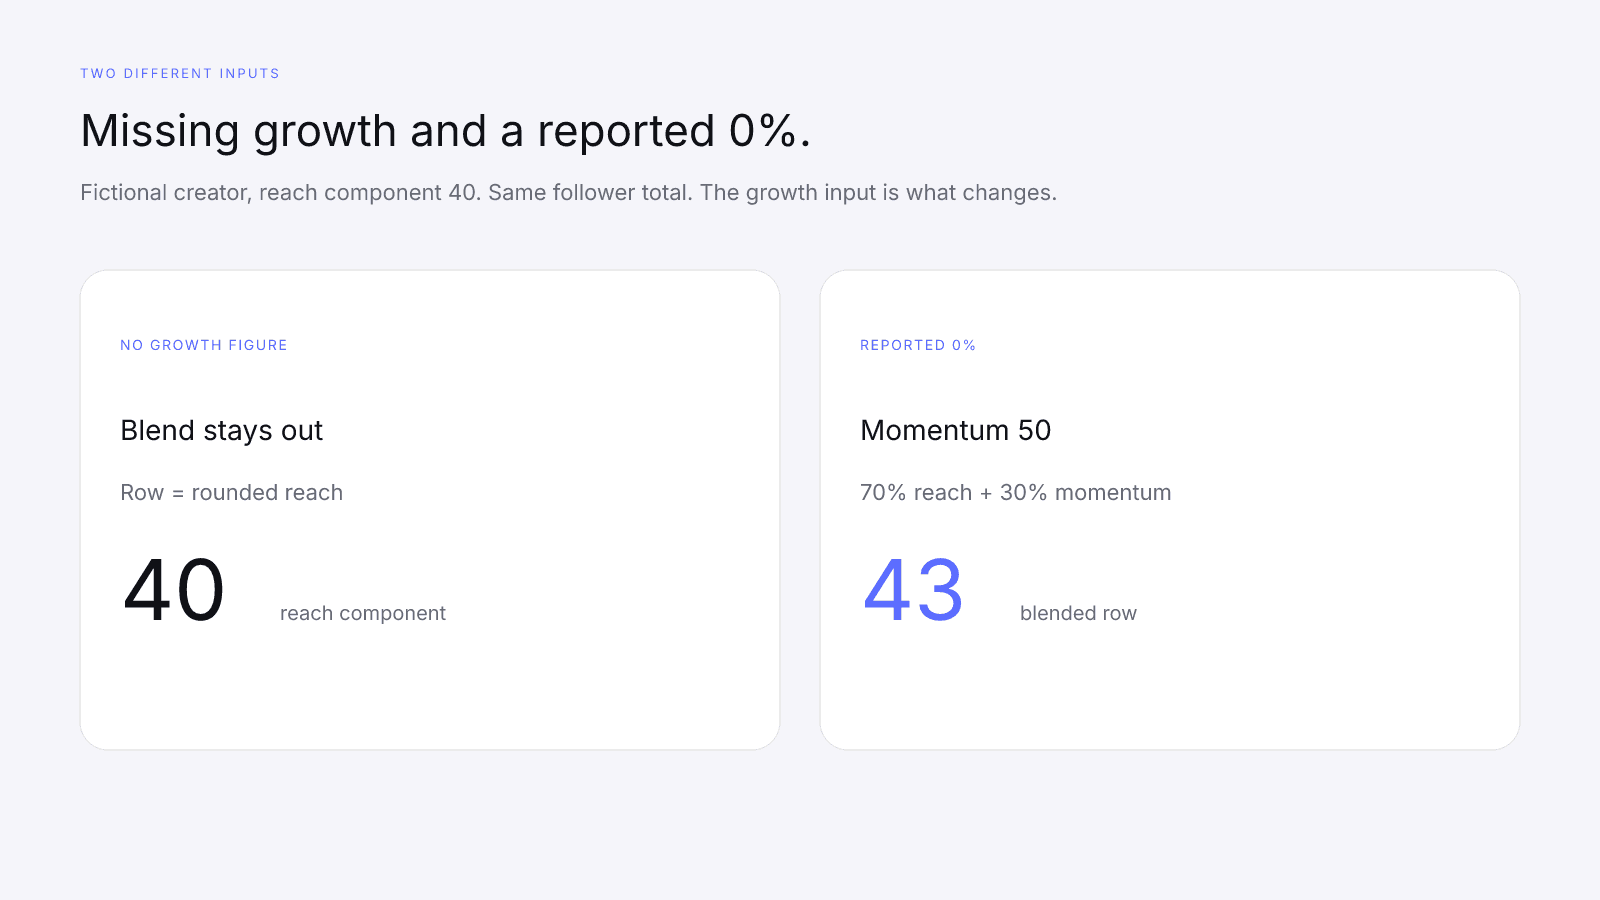
No growth figure: the blend doesn't run, so reach and momentum is 40.
Reported 0%: momentum is 50. round(0.7 × 40 + 0.3 × 50) is 43.
Reported +10%: momentum is 70. round(0.7 × 40 + 0.3 × 70) is 49.
Reported -10%: momentum is 30. round(0.7 × 40 + 0.3 × 30) is 37.
Reported +30%: momentum is capped at 100. round(0.7 × 40 + 0.3 × 100) is 58. A reported +25% gives the same 58, because both sit on the cap.
Reported -30%: momentum is floored at 0. round(0.7 × 40 + 0.3 × 0) is 28. The momentum term adds nothing, and 70% of the reach component is 28.
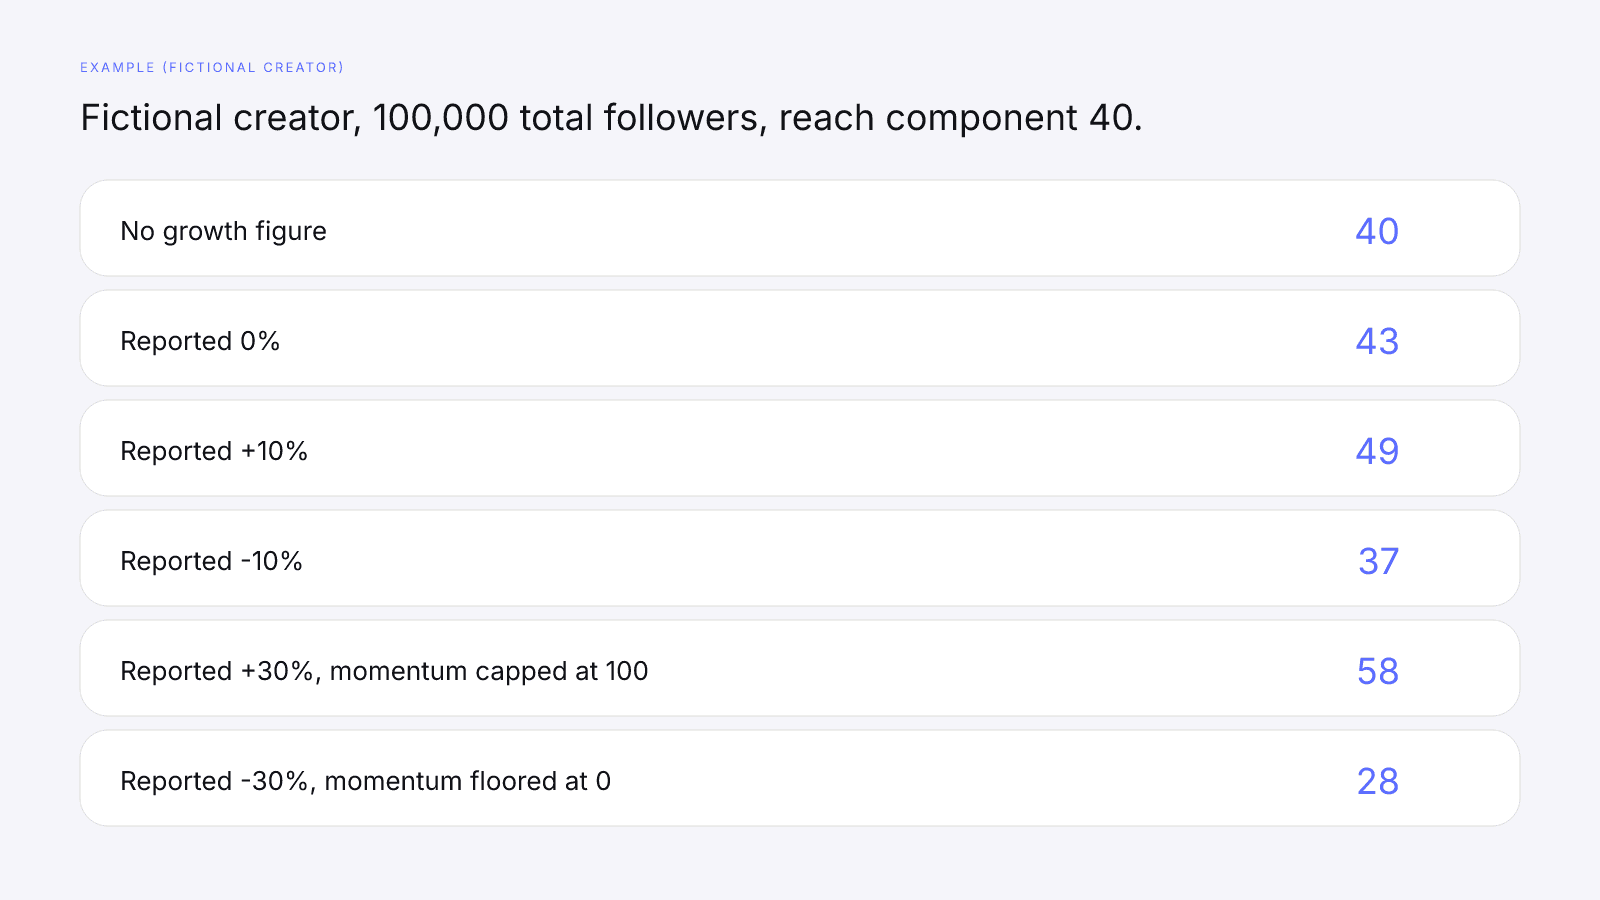
40 and 43 share a follower total. One input is missing, and the other is a reported 0%. 58 and 28 don't sit evenly around 40, because +30% is capped at momentum 100 and -30% is floored at momentum 0.
Fictional creator, 10,000 total followers, reach component 20, with a reported +10%. log10(10,000) is 4, and (4 - 3) / 5 × 100 is 20. Momentum is 70, and round(0.7 × 20 + 0.3 × 70) is 35. The growth figure matches the +10% line above, but the row comes out lower because the reach component is 20.
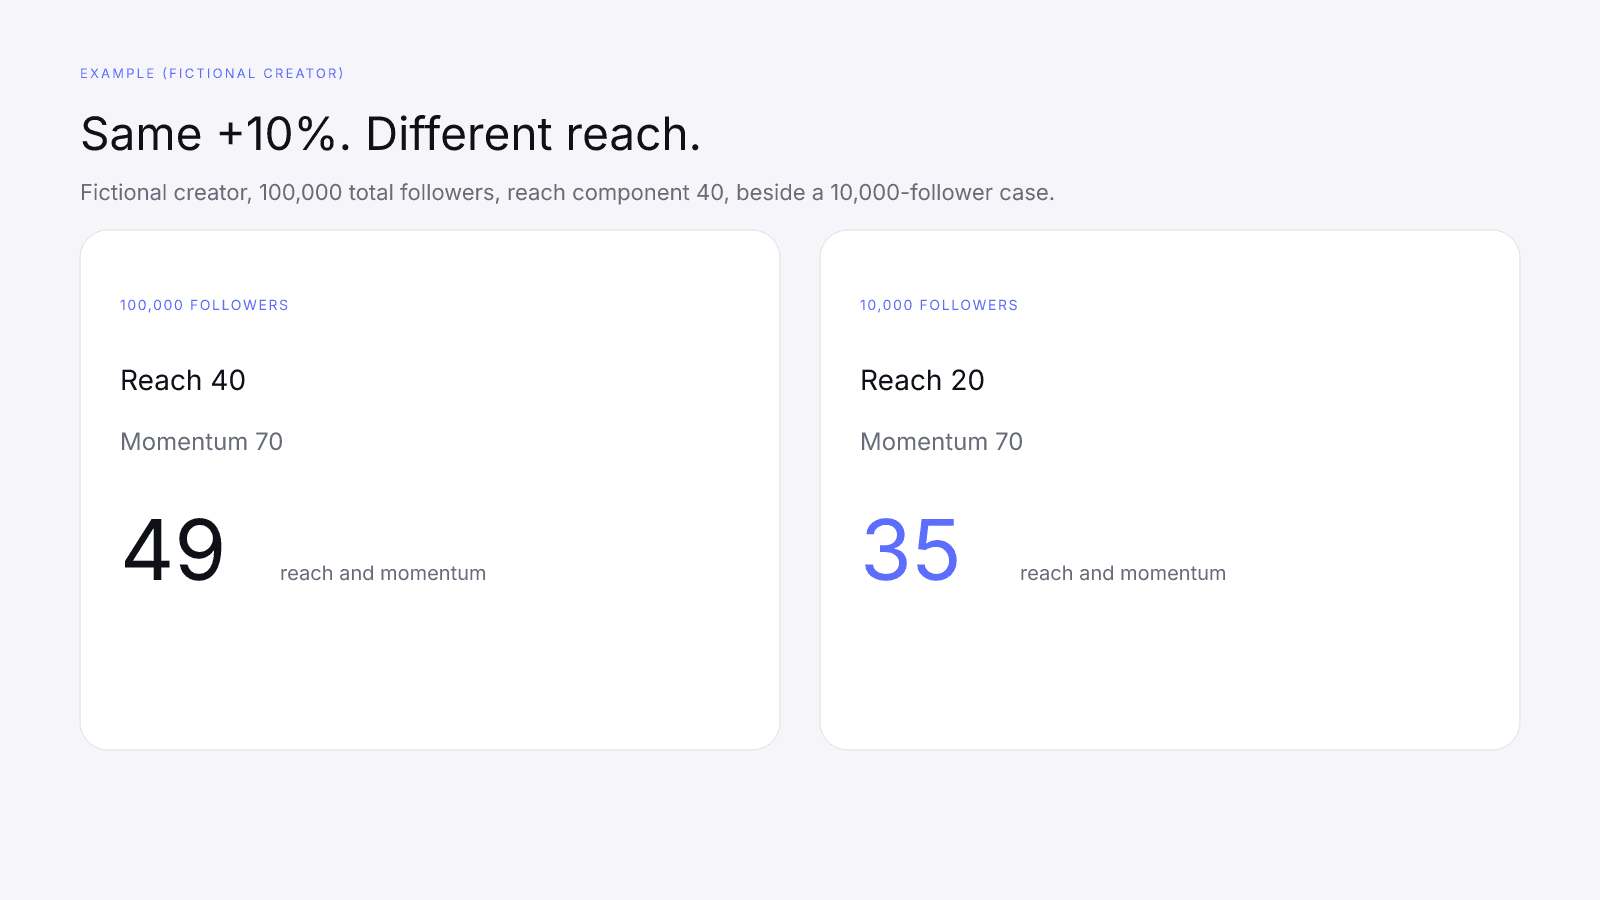
Any move on this row is a move in one factor, and on model 2026-08-18.1 that factor carries a 23% weight in the composite. The composite also depends on the other factors that ran, so these examples stop at the row.
What negative growth does
Negative growth is allowed. Momentum falls below 50 as soon as growth drops under 0%. At -10%, momentum is 30, because 50 + 2 × -10 is 30. At -30%, momentum is floored at 0: 50 + 2 × -30 is -10, and the clamp lifts that to 0. Anything at or below -25% shares the same floor.
Negative growth can lower the row when momentum is below the reach component. On the fictional creator, -10% prints 37 and -30% prints 28, both under the reach component of 40. When the reach component is already low, the same momentum can sit above it and lift the row.
Nothing else is penalized. There is no growth flag, and the growth figure doesn't touch the other factors. The drop stays inside the momentum term, which is 30% of one row.
Missing growth is not 0% growth
A missing growth figure and a reported 0% take different paths. Missing means the row is reach alone: round(reach). A reported 0% is a real figure, so momentum is 50 and the 70/30 blend runs. Reading a blank as 0% would invent a momentum score of 50.
On the fictional creator, with its reach component of 40, no growth figure prints 40 and a reported 0% prints 43, from round(0.7 × 40 + 0.3 × 50). Only the growth input differs.
A dash is a third state. Reach and momentum shows a dash when the follower total is missing or not above zero, which means the row didn't run: there's no reach component to round and no blend to apply. A dash is missing data, not zero. On model 2026-08-18.1 the 23% weight of a dashed row is held out of the composite, and Missing Data on Creator Metrics: Why Dashes Beat Fake Zeros has the coverage arithmetic.
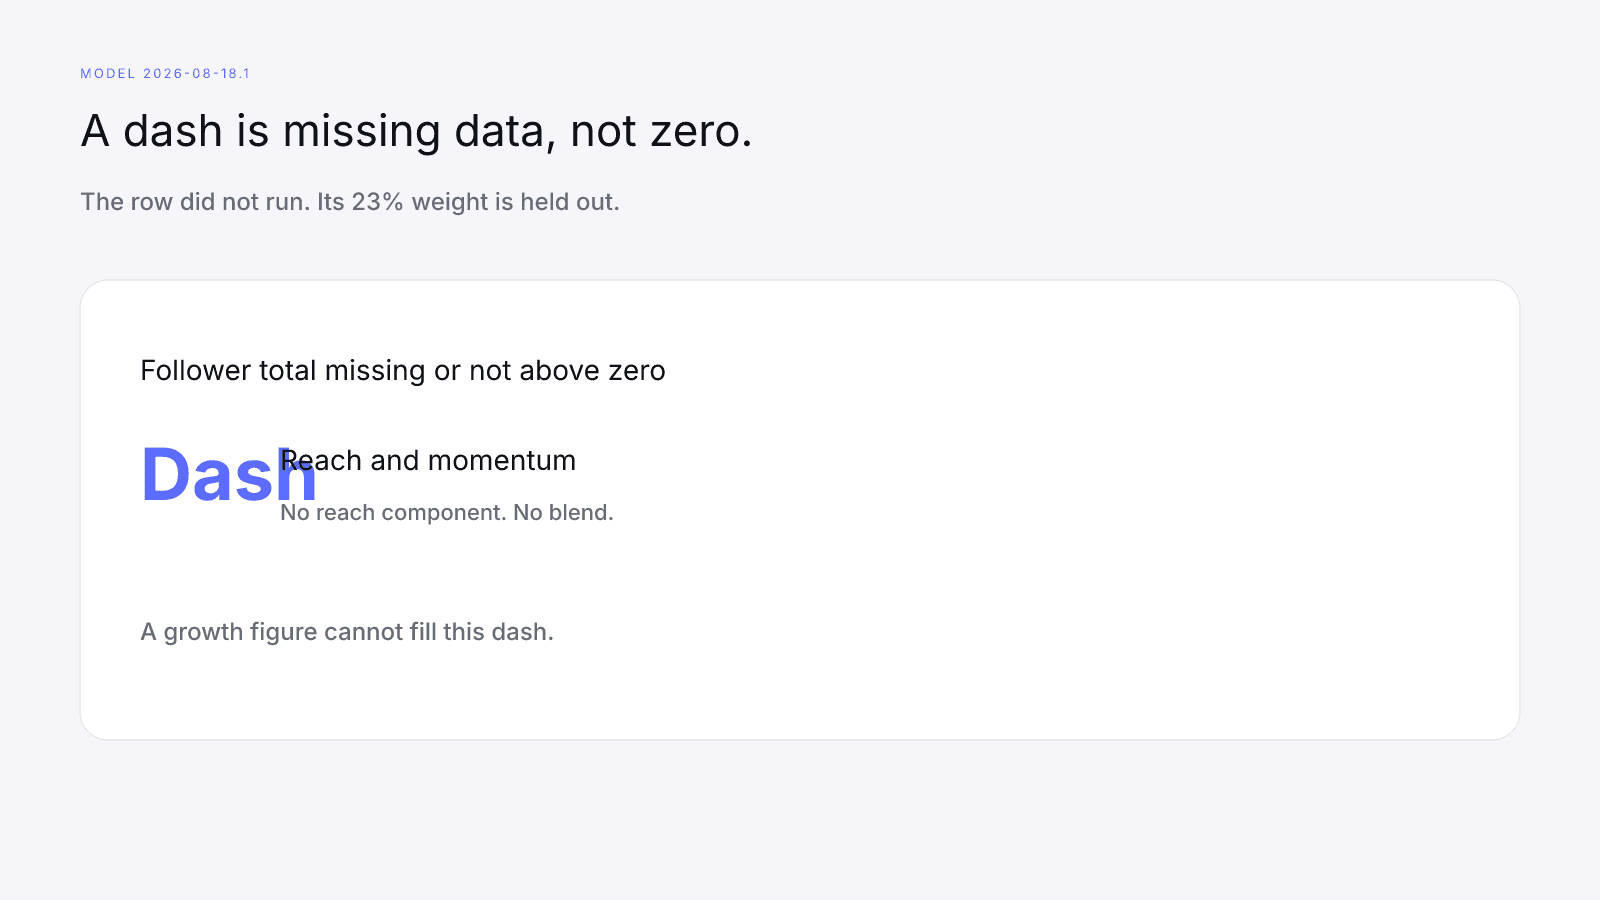
A growth figure can't fill that dash, since the blend needs a reach component from a follower total above zero first.
What you see on the free card and in the paid report
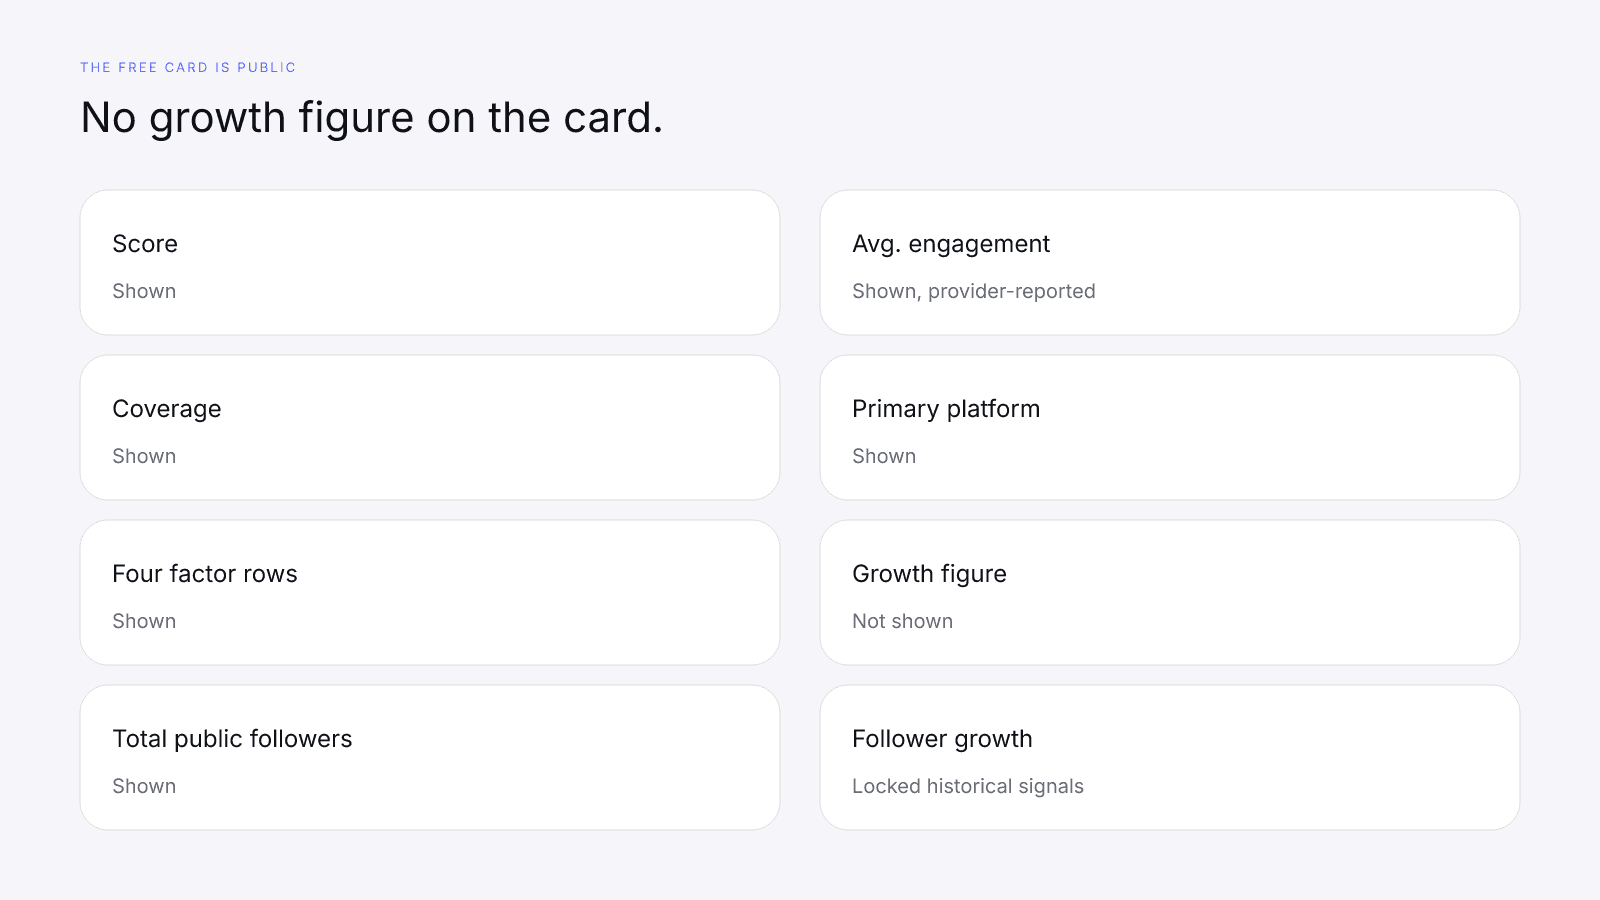
The free card shows the score, the coverage line, the four factor rows, Total public followers, Avg. engagement, and Primary platform. Avg. engagement is provider-reported. The card shows no growth figure, and it does not show whether the blend ran, so a row can already include a blend while the card prints no growth percentage. The locked "Follower growth" preview panel is subtitled "Locked historical signals". The card is public, needs no sign-up, and prints no date.
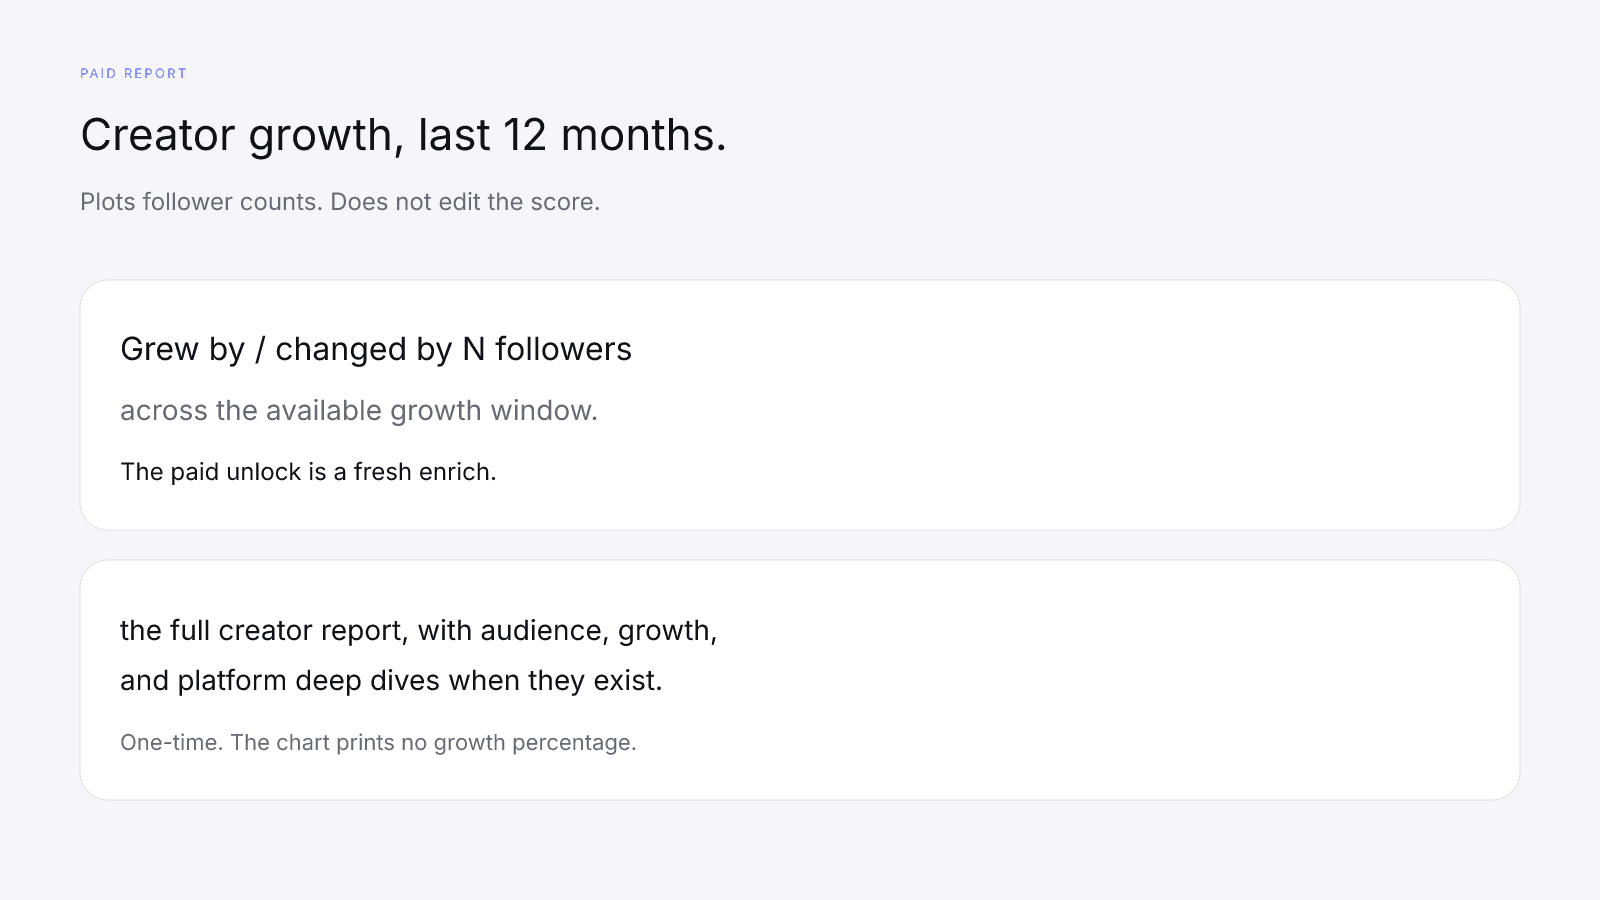
When the provider returned growth data, the paid report can show it. Each platform deep dive has a "Creator growth" chart labelled "Last 12 months", which plots follower counts and says the account grew by or changed by N followers across the available growth window. With fewer than 2 points, it reads "Unavailable". The chart prints no growth percentage, and it does not edit the score. The unlock keeps the free card's score, coverage, factors, and model id. The paid unlock is a fresh enrich, so the chart may not match the data that fed momentum, and charts for the other apps do not touch the score.
The $0.99 purchase is the full creator report, with audience, growth, and platform deep dives when they exist. It's a one-time purchase, and Free InfScore vs the $0.99 Report: What Actually Changes lists everything else the report adds. Paying doesn't fill a dash, and it doesn't change the weights on model 2026-08-18.1.
What follower growth can't tell you
A growth figure is a change in follower counts on one app. It isn't engagement, audience quality, fit, rates, or campaign results, and it says nothing about who the new followers are or why they showed up. InfScore has no spike or bought-growth detection, and a growth figure carries no flag. A fast-growing creator doesn't get a higher composite by default, because growth is one part of one row.
It is not a percentile, price estimate, or guarantee of campaign results. What Is an Influencer Score? How InfScore Builds One covers what the composite can and can't tell you, and How to Measure Influencer Performance goes through the checks that sit outside it.
FAQ and next steps
Search a public profile from infscore.com. The card is public and needs no sign-up. Read the reach and momentum row next to the model id, note the date you viewed the card, and treat any dash as missing data.
For the one-time $0.99 report, see Pricing.
How does follower growth affect an influencer score?
Follower growth feeds momentum, which is 30% of the Reach & momentum factor. Momentum is clamp(50 + 2 × the growth percentage), and the row is round(0.7 × reach + 0.3 × momentum) when a growth figure is present. On model 2026-08-18.1 that row is 23% of the composite.
Does negative follower growth lower the score?
It can lower the reach and momentum row. Momentum falls below 50 and is floored at 0 at -25% or lower. When momentum is below the reach component, the row lands below reach. On the fictional creator with 100,000 total followers and a reach component of 40, -10% prints 37 and -30% prints 28. Nothing else is penalized, and there is no growth flag.
What happens when follower growth data is missing?
The row is the rounded reach component, reach only. Missing growth is not the same as a reported 0%, which sets momentum to 50 and runs the blend. On the fictional creator, missing growth prints 40 and 0% prints 43. A dash is a different case: it means the follower total is missing or not above zero, and a dash is missing data, not zero.
Which platform's growth does InfScore use?
The requested app's 12-month follower growth, from the provider's data. Growth on the creator's other apps does not enter momentum. Follower counts on Instagram, TikTok, and YouTube still enter reach, and X is excluded from that total.
Why doesn't the free card show the growth number?
The free card shows no growth figure, and it does not show whether the blend ran. Growth sits behind the locked Follower growth panel, subtitled Locked historical signals. The score itself still uses growth when the provider returned it. The card is public and needs no sign-up.
Does a fast-growing creator get a higher InfScore?
Not by itself. On model 2026-08-18.1, growth is 30% of a 23% factor, and whether it lifts the row depends on whether momentum is above or below the reach component. The other factors still count. It is not a percentile, price estimate, or guarantee of campaign results.
Does the paid report show follower growth?
When the provider returned it, yes. The Creator growth chart, labelled Last 12 months, plots follower counts and prints no growth percentage. The $0.99 purchase is the full creator report, with audience, growth, and platform deep dives when they exist, as a one-time purchase. The paid unlock is a fresh enrich, so the chart may not match the data that fed the score.