How to Measure Influencer Performance (Beyond Follower Count)
Learn how to measure influencer performance with audience quality, engagement, reach, and platform signals — and how InfScore rates creators 0–100.
This versioned composite uses only available public signals. Missing factors stay unavailable and their weight is rebalanced across observed factors. It is not a percentile, price estimate, or guarantee of campaign results. Model 2026-08-18.1.
Follower count is a weak proxy for influencer performance. A big audience can be bought, inactive, or mismatched to the work. Stronger measurement starts with public signals you can actually check: whether the audience looks credible, how much real engagement the posts earn, how reach and growth move over time, and whether the creator shows up on more than one network.
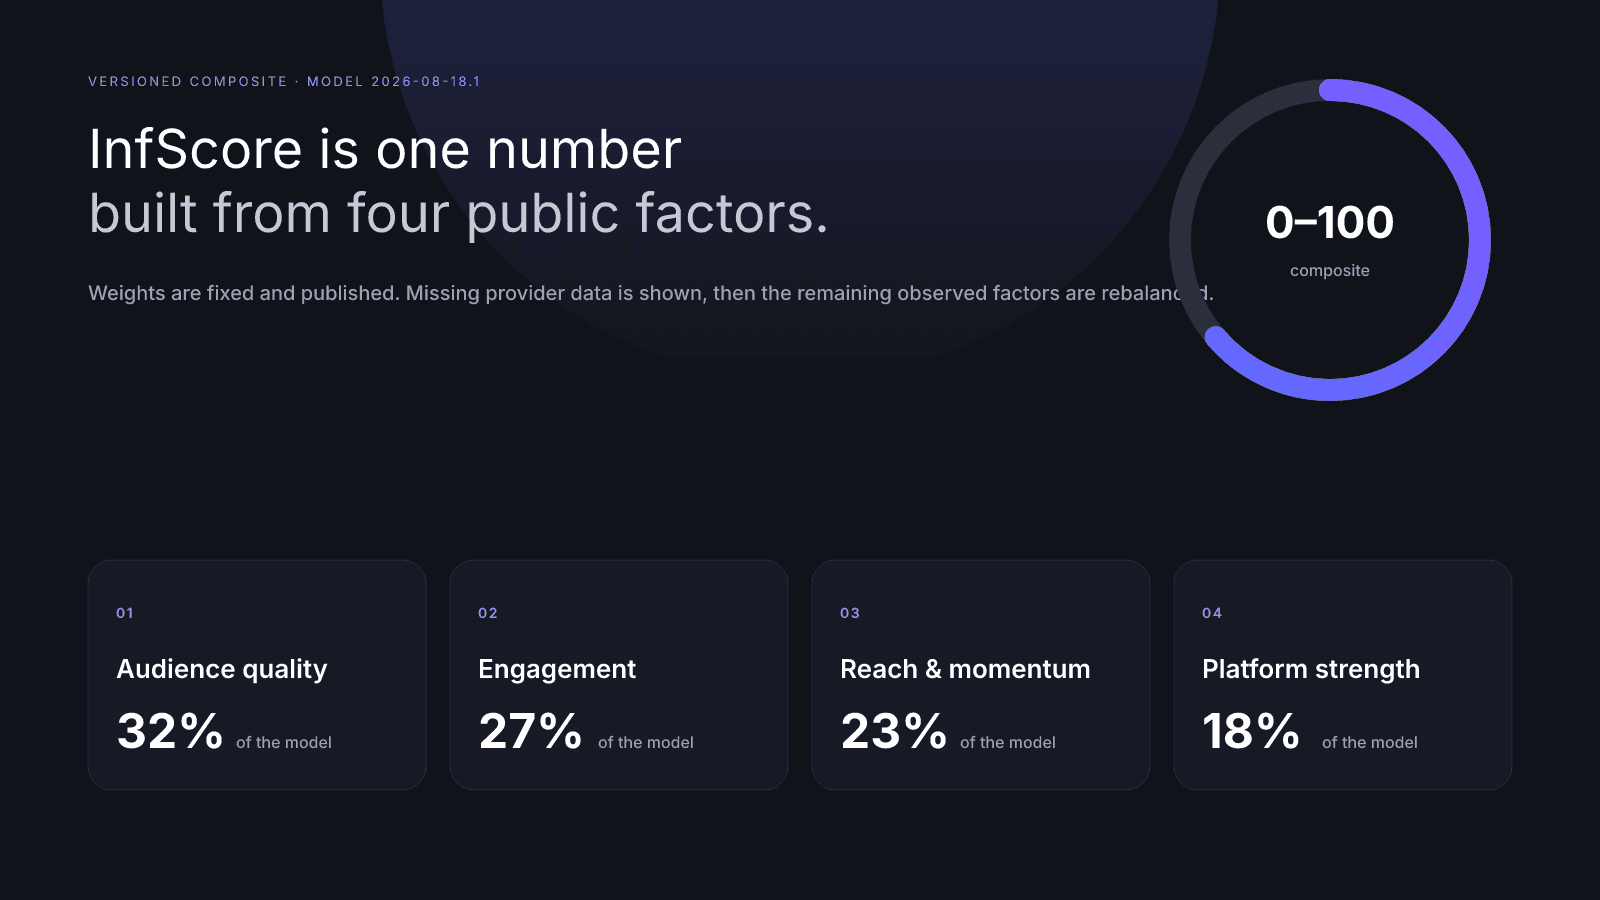
InfScore turns those four signals into a versioned 0–100 public score for Instagram, TikTok, and YouTube profiles. The published mix is audience quality 32%, engagement 27%, reach & momentum 23%, and platform strength 18%. It only uses the provider signals that exist. If a signal is missing, the scorecard shows the gap.
That gap handling is the product, not a footnote. A public influence rating that invents missing pieces turns into a mood board. InfScore is meant to stay comparable when the data is incomplete, and honest when it is.
This guide covers how to read those factors on the current public model (2026-08-18.1), how the free score works, what the optional $0.99 report adds, and the ethical public-signal work that can change the inputs. It does not rank InfScore against other tools, and it does not invent case-study percentages.
What InfScore is (and what it isn't)
InfScore is a public-signal rating. Search a creator on infscore.com, and you get a free 0–100 number, a tier label, four factor rows, and a scoring-coverage percentage. No account is required for that public score.
It isn't a price quote, a percentile, a follower vanity index, or a promise that a brand deal will work. The scorecard is direct about this: available factor weights are normalized when provider data is missing, and the result is not a campaign forecast.
Two other limits matter up front.
InfScore only sees public creator data that a provider returns. Private accounts, incomplete graphs, and fields a provider does not supply cannot be scored. InfScore will not fill those blanks with a guess.
The model is versioned. The current public model id is 2026-08-18.1. If the formula changes later, the version string on the scorecard changes with it. Compare two scores only when you also look at the model id and the coverage percentage.
Shortest path through the product: search, read the four factors, note any dashes, then decide whether the denser full report is worth a one-time $0.99.
The four factors, in order of weight
Every InfScore is assembled from the same four independently calculated factors. The percentages on the homepage and on every scorecard are the percentages the model uses.
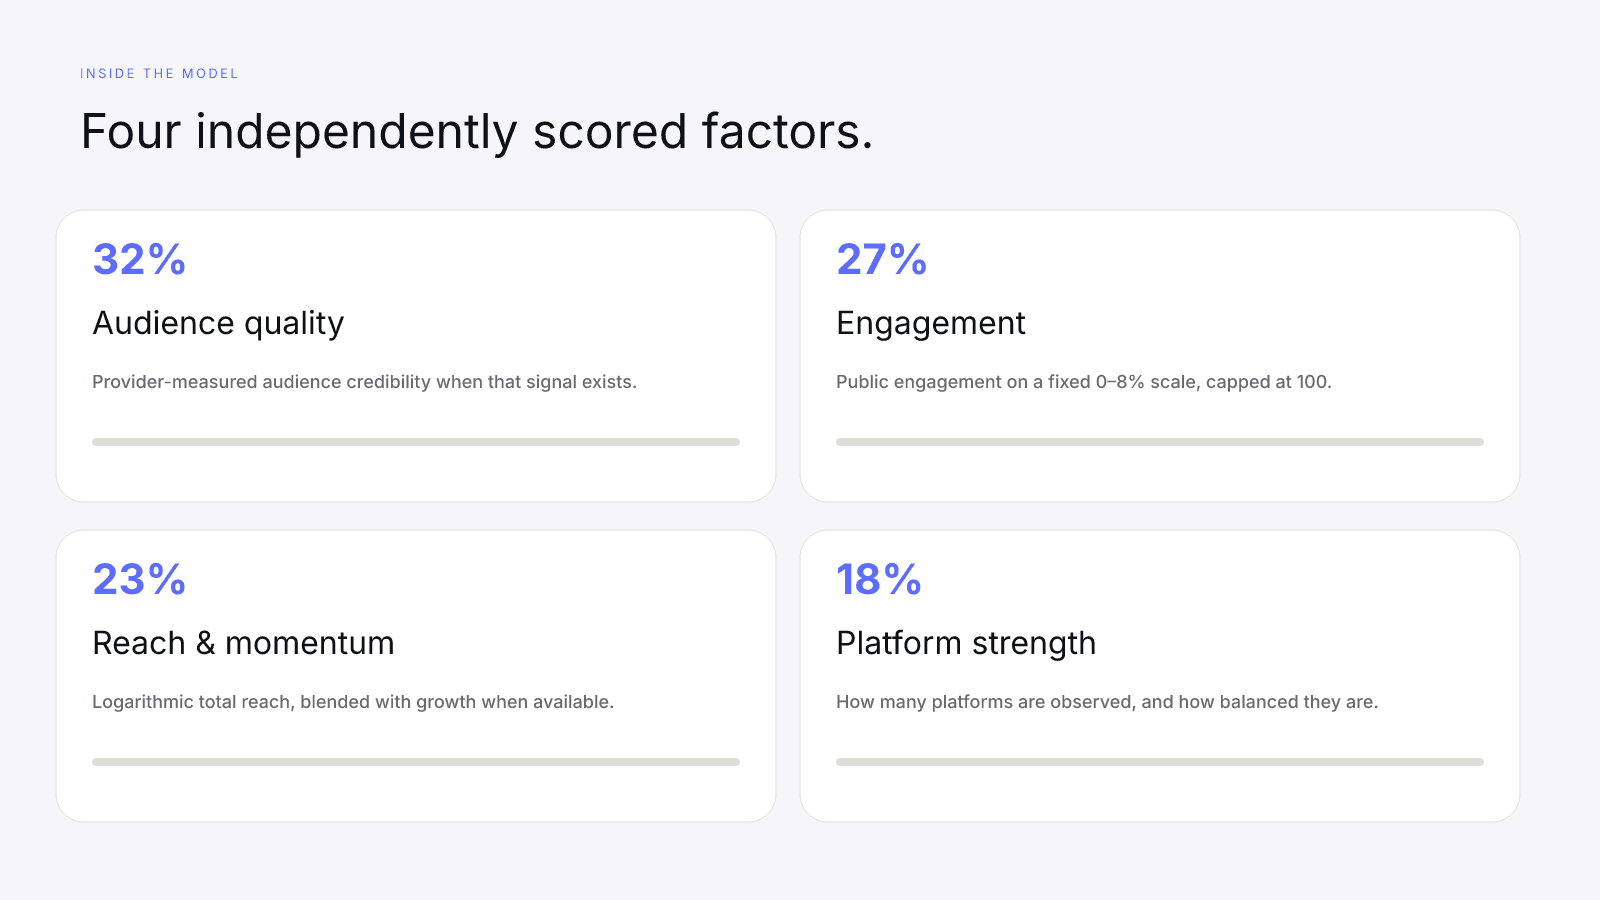
| Factor | Weight | What it scores |
|---|---|---|
| Audience quality | 32% | Provider-measured audience credibility when that signal exists |
| Engagement | 27% | Public engagement on a fixed 0–8% scale, capped at 100 |
| Reach & momentum | 23% | Logarithmic total reach, blended with measured growth when available |
| Platform strength | 18% | Observed platform coverage and balance across public audiences |
Independently calculated means a strong engagement factor cannot borrow points from a missing audience-quality factor. Each row is computed from its own inputs. The composite only mixes the rows that actually returned a number.
Audience quality (32%)
Audience quality is the heaviest factor because follower count without credibility is a noisy input. This factor uses provider-measured audience credibility when the provider returns it. On the public scorecard it appears as a 0–100 factor score, or as a dash.
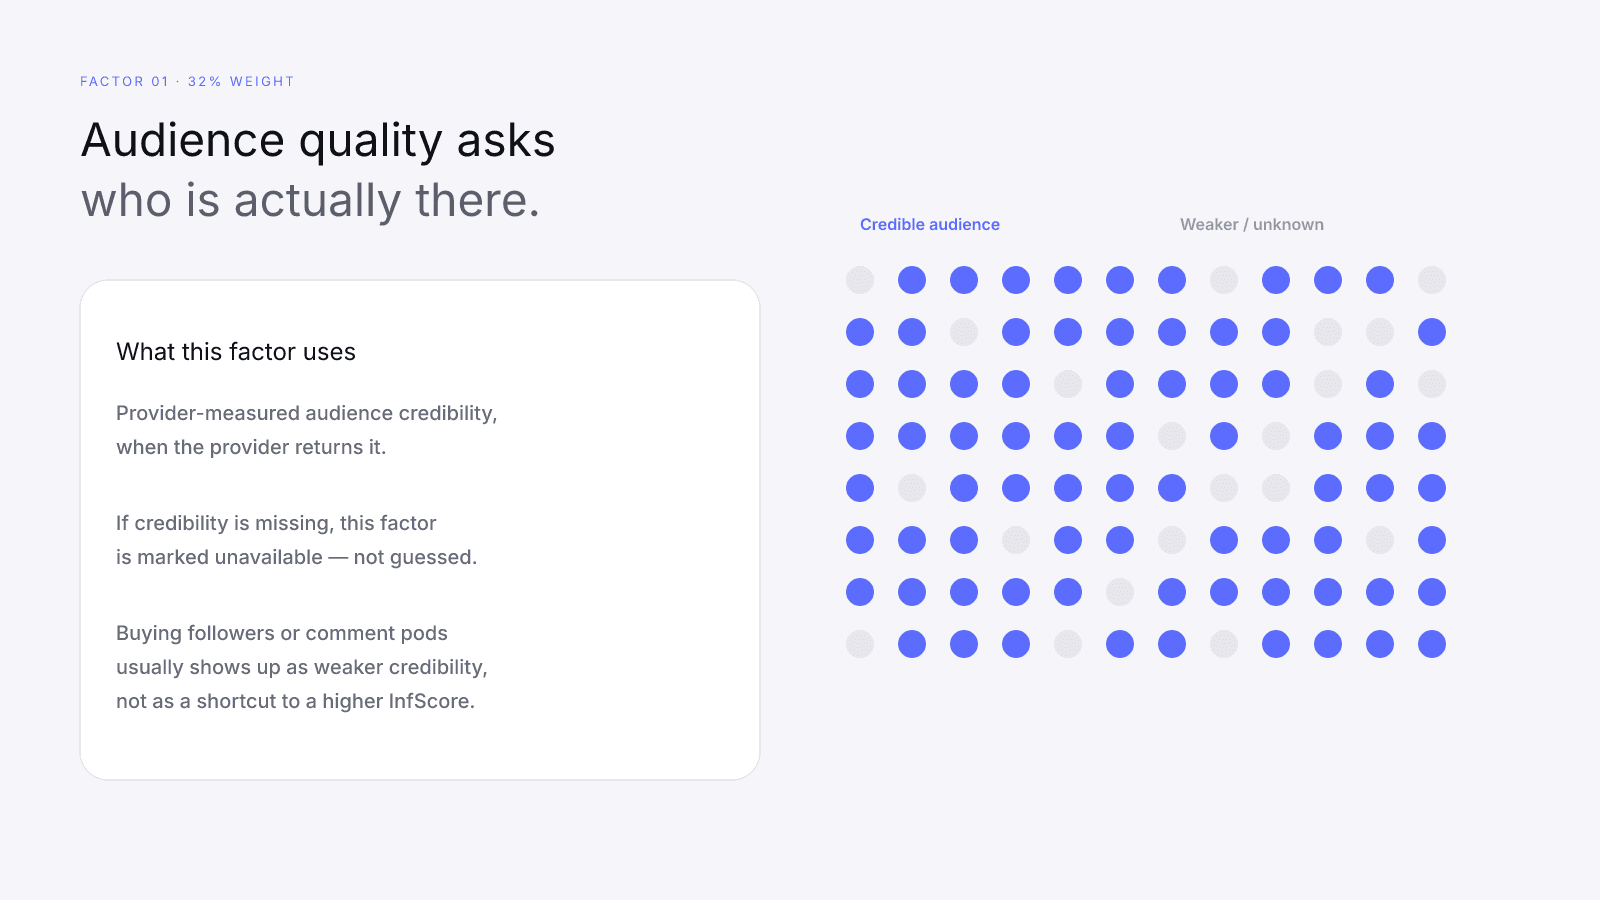
A high audience-quality score means the provider's credibility signal for that public audience was strong. A lower score means that signal was weaker. A dash means InfScore did not receive the input, so the factor is unavailable.
This is the factor most distorted by shortcuts. Bought followers, recycled comment pods, and giveaway traffic that never comes back tend to show up as a less credible audience (when the provider can see them at all). InfScore does not need you to confess to that behavior. If the public audience looks thin, the factor will say so.
Practical public-signal work here is unglamorous:
- Publish for people who already care about the topic, not for a rented crowd.
- Prefer collaborations with audiences that overlap yours, instead of mass shoutouts from unrelated accounts.
- Treat giveaways as a reach tactic, not an audience-building tactic.
- If you manage several brand accounts, keep the creator identity distinct so the provider graph stays clean.
You cannot type a credibility number into InfScore. You can only change the public audience the provider measures.
Engagement (27%)
Engagement strength converts a public engagement rate onto a fixed 0–8% scale. Eight percent is the top of that scale: it maps to 100 on the factor. Values above 8% are capped so a single outlier posting burst cannot take over the composite.
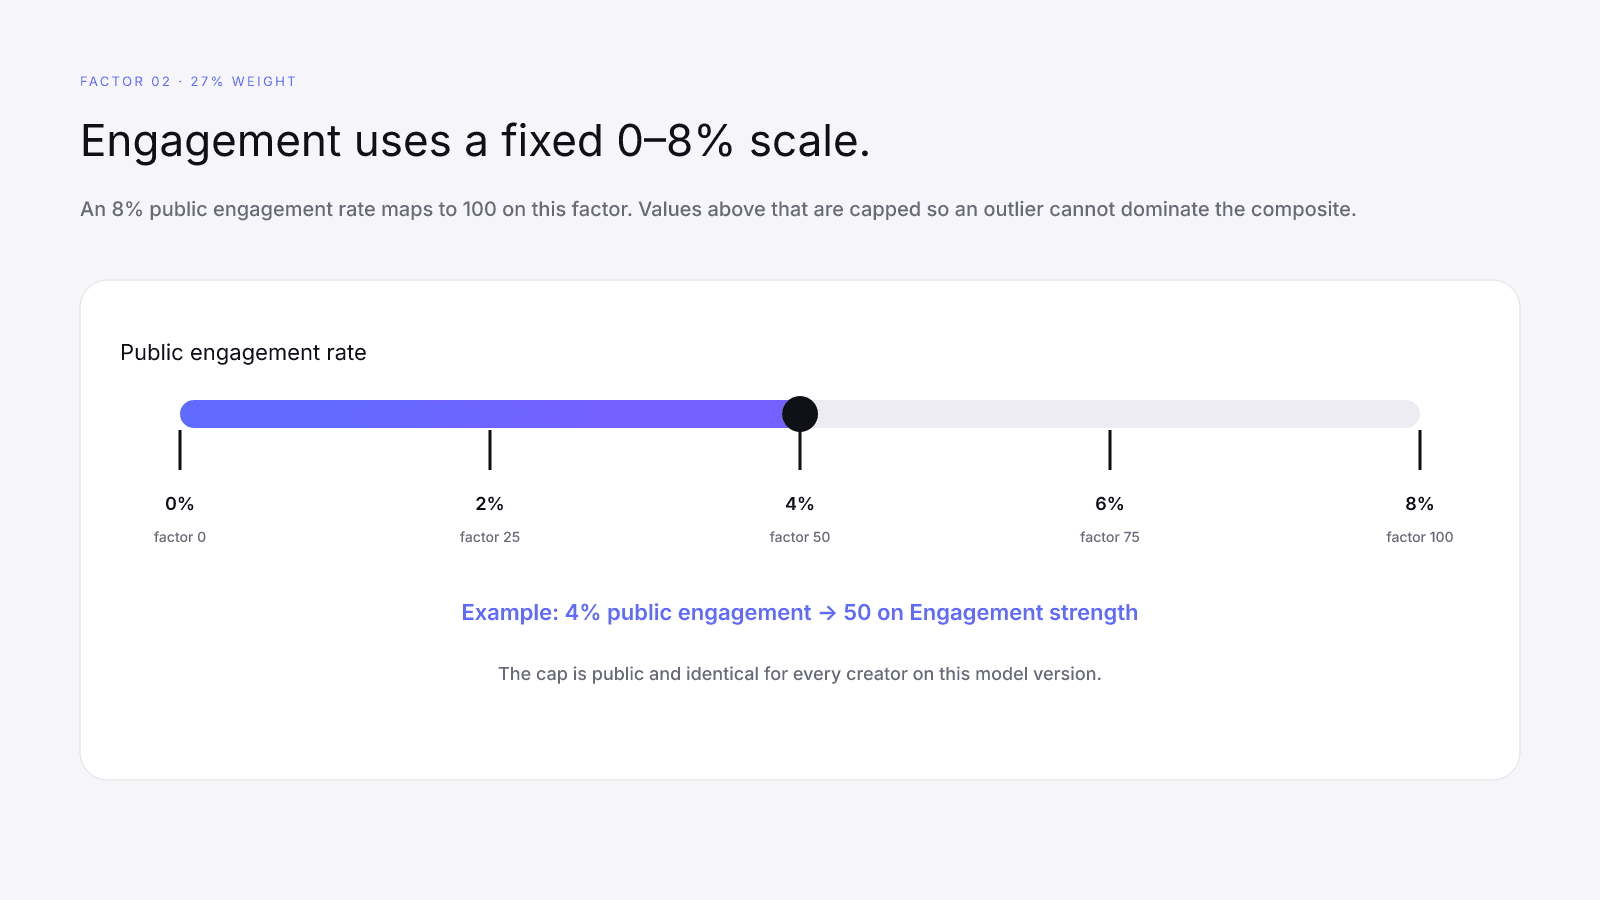
That cap is public and identical for every creator on this model version. A 4% public engagement rate maps to 50 on the factor. A 2% rate maps to 25. The math is linear until the cap, then it stops.
What InfScore skips: inventing a "good engagement rate for your niche," comparing you to an unpublished peer set, or rewarding comment volume from accounts that never watch the work. The public engagement percentage is the input. The 0–8% scale is the conversion.
Useful habits that do not require fake activity:
- Ask questions that take a sentence to answer, then reply to the people who bother.
- Make at least some posts worth saving or sending (guides, templates, tight explainers) rather than only posting for a first-second spike.
- Keep posting quality closer to even than to feast-or-famine. A single viral ratio does not define the factor once the cap is in play.
- Do not buy comments. Pods and bots can inflate a raw ratio for a moment and still leave you with a weaker audience-quality row.
If engagement is missing entirely, the factor is a dash. InfScore will not substitute likes-per-follower from a different platform to hide the gap.
Reach & momentum (23%)
Reach is logarithmic, not a richest-follower contest. On the current model, logarithmic reach runs from about 1,000 public followers (0 on that piece) through 100 million (100). That compresses the gap between a large account and a gigantic one, and it keeps mid-size creators on the same chart.
When a growth percentage exists, the factor becomes a blend: 70% logarithmic reach and 30% momentum. Momentum is itself a bounded transform of that growth signal. If growth is missing, reach still scores on its own.
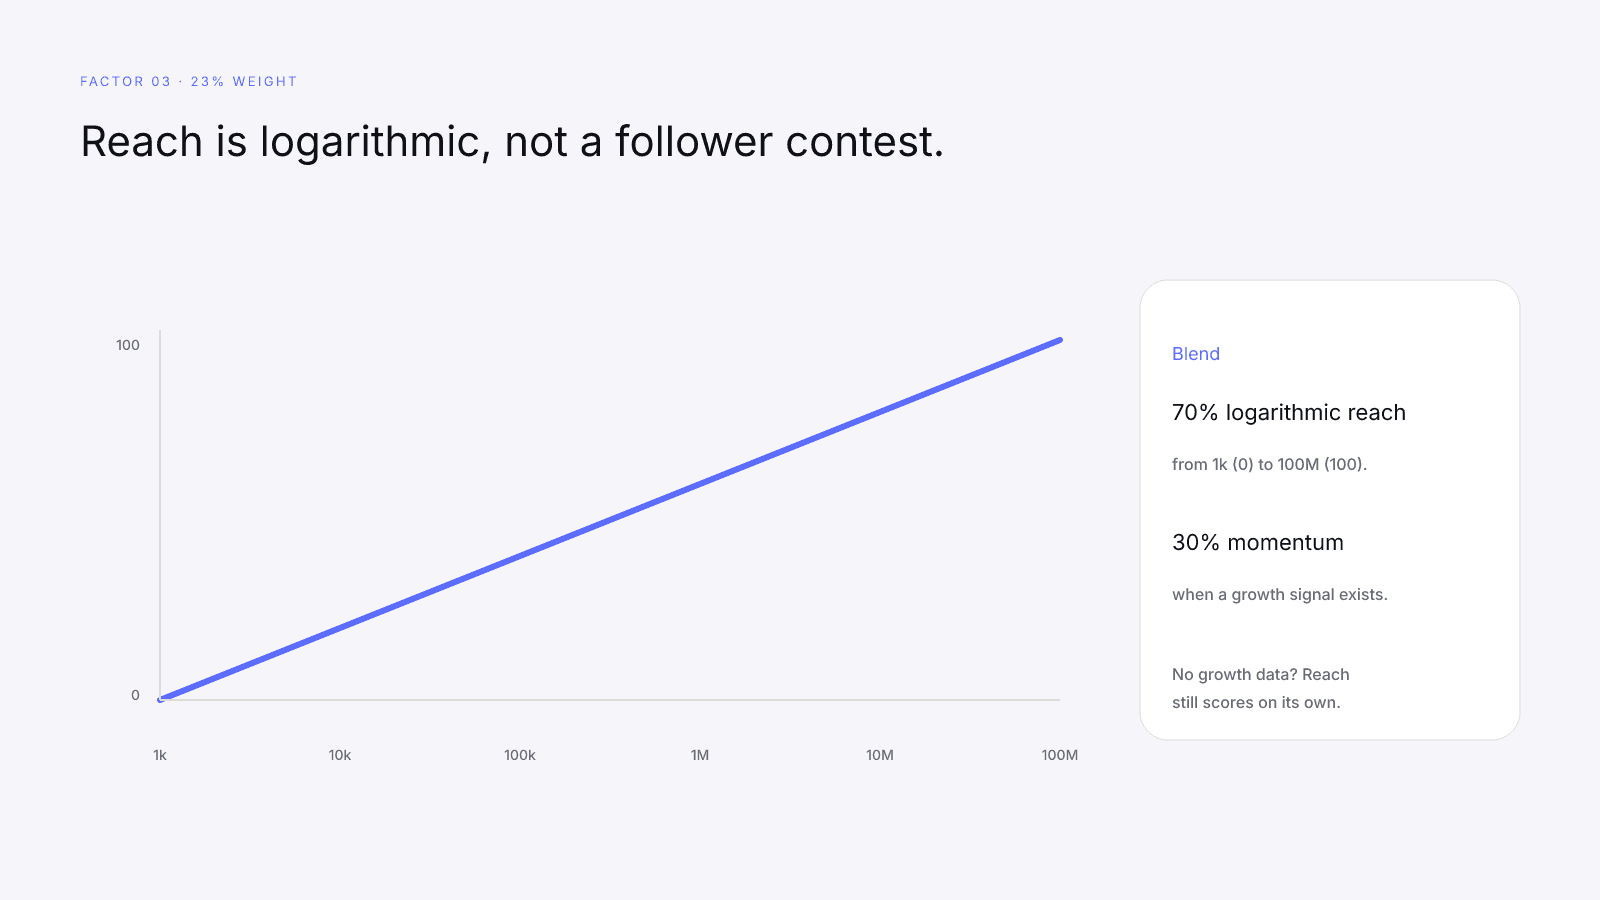
Read that twice if you have been taught that more followers always win. InfScore still moves as public reach grows, but it will not treat 80 million as eight times 10 million on this factor. The log scale is the point.
Public-signal work that can change this row:
- Post on a cadence you can actually keep. Momentum is measured from provider growth, not from a stated posting goal.
- Build on the platform where your work already compounds, then extend. Do not fragment across three empty profiles.
- Treat subscriber and follower quality as part of reach. A spike of accounts that never return is a weak growth story even if the headline count jumped.
- Remember that total public followers are summed from observed platform counts. A platform the provider did not return does not add to the total.
InfScore will not estimate your "true reach" from impressions it cannot see. Views, watch time, and fill-rate live in the paid report when the provider sends them. They are not smuggled into the free composite.
Platform strength (18%)
Platform strength is the smallest weight, and it is the most misunderstood. It does not pick a "best" platform. It scores how many public audiences were observed and whether those audiences are badly lopsided.
On the current model the coverage floors are:
- 1 observed platform → 45
- 2 observed platforms → 70
- 3 or more → 90, plus a small balance bonus when follower counts are not concentrated on a single network
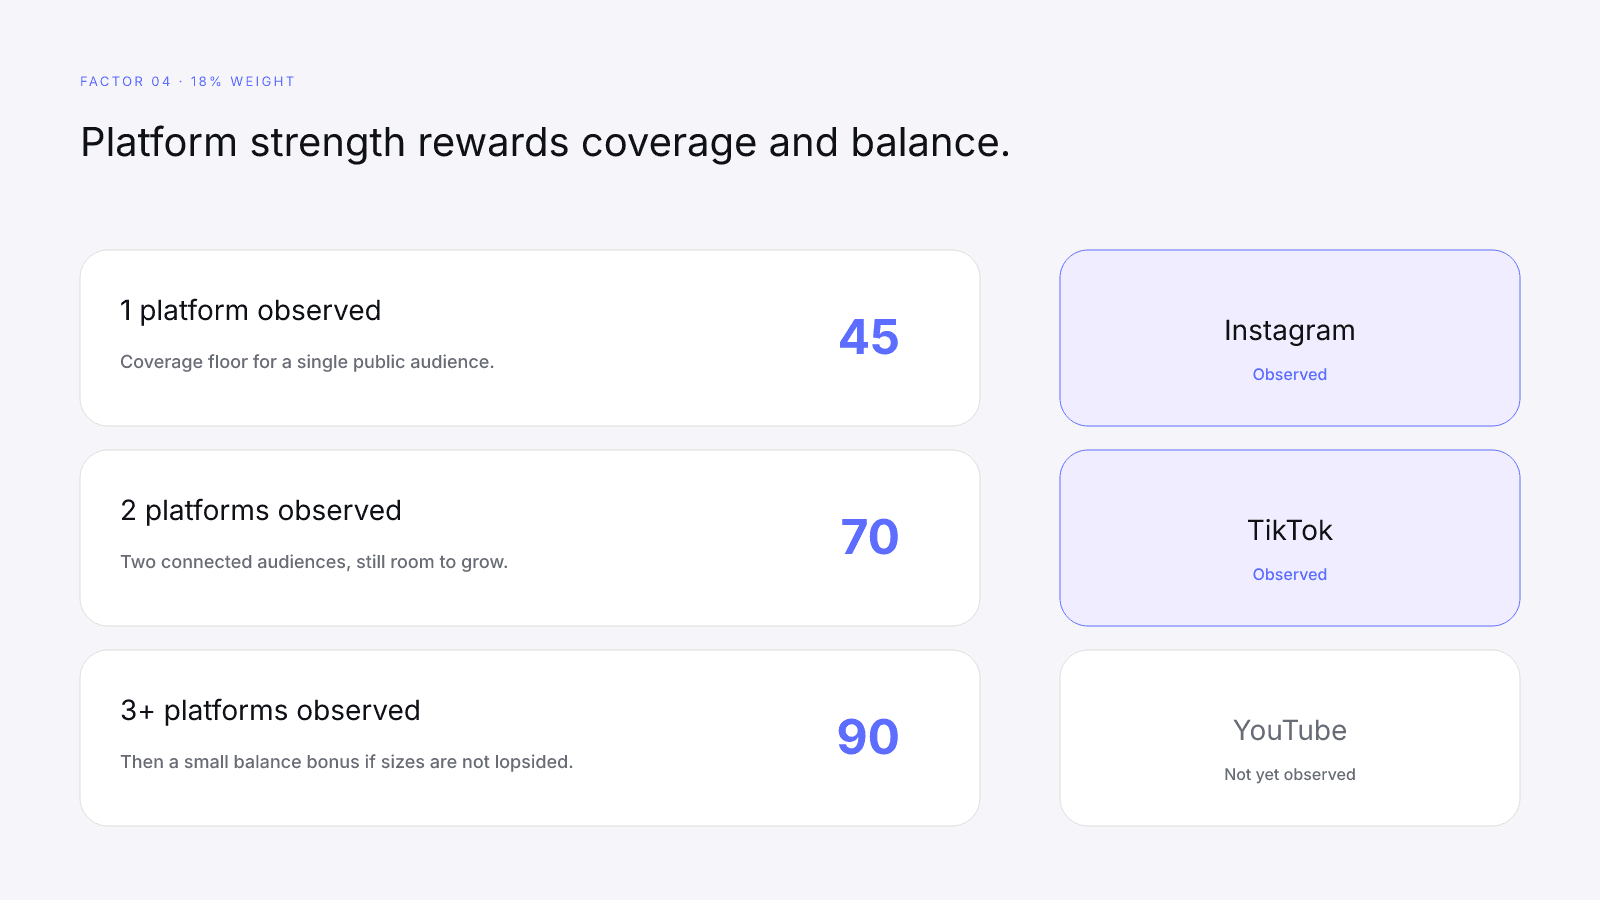
A creator who actually posts on Instagram and TikTok, with both graphs returned, will usually outrank a creator who is huge on one network and invisible everywhere else on this factor (not necessarily on the whole InfScore). Reach still has its own row.
The ethical move is not to spam three platforms with the same unused handle. It is to use the same public identity on the networks where you do publish, so a provider can connect them. Empty duplicate accounts do not help coverage, and they can make the graph messier.
If only one platform is observed, the factor can still return a number. It will sit near that 45 coverage floor. That is information: InfScore saw a single public audience. The dedicated reading of that row is Cross-Platform Creators.
What "missing data shown" means
This is the sentence most people skip, and the one that decides whether you can trust the number.
If a provider signal is unavailable, InfScore shows that gap. The factor score is null on the scorecard: a dash, not a quiet zero. The copy on every public score page is explicit: missing factors stay unavailable, and their weight is rebalanced across observed factors. The gap is never inferred from the final score.
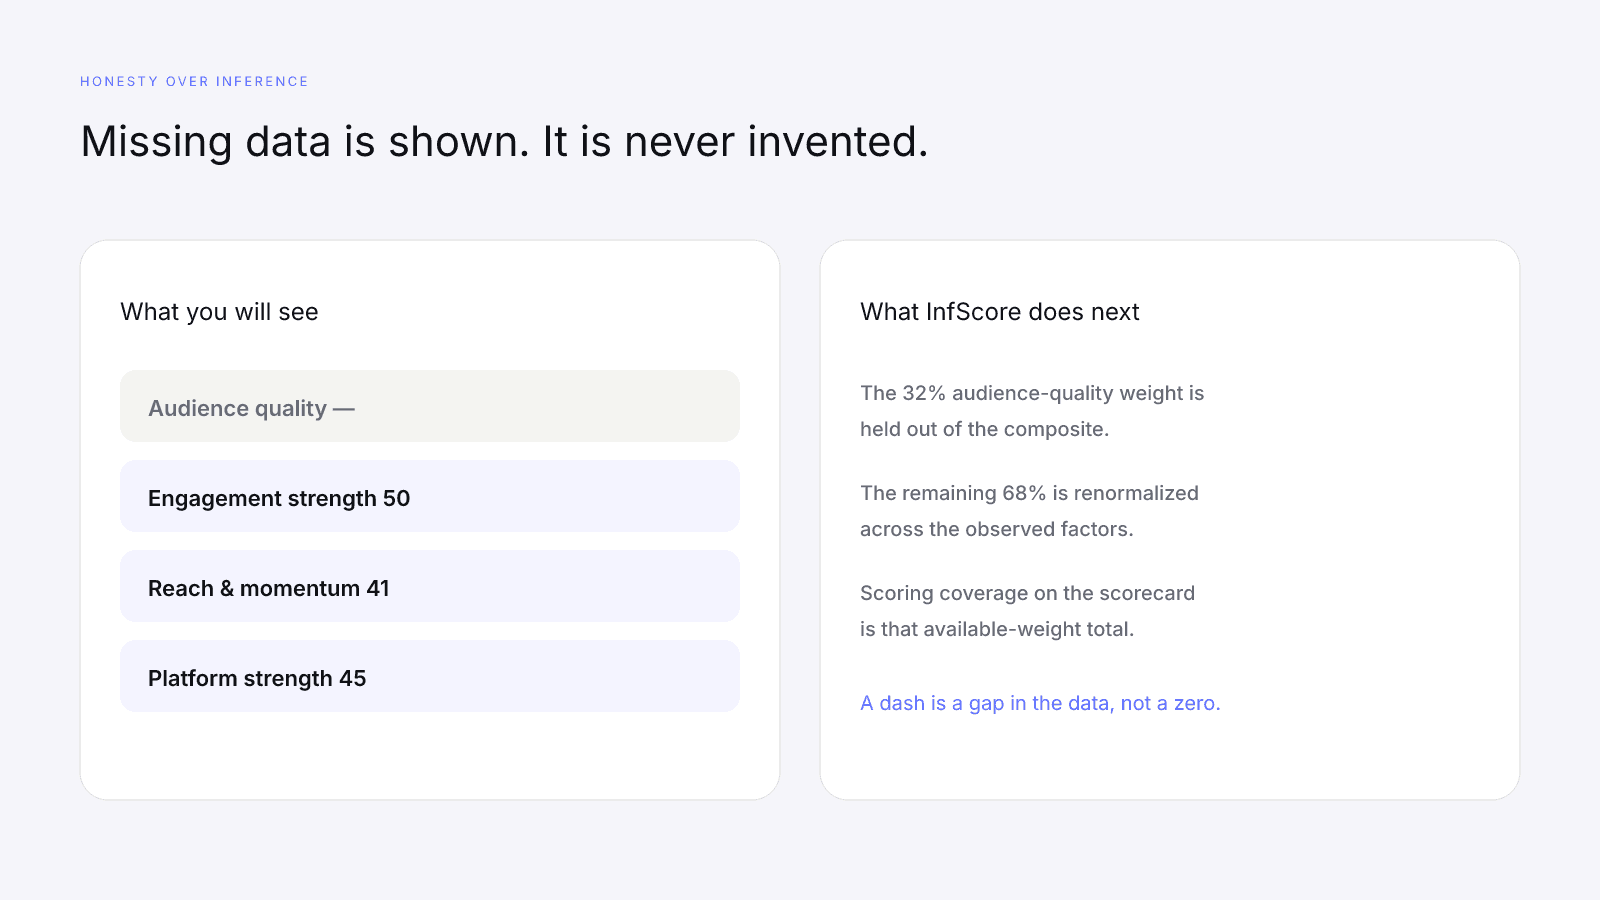
A dash is not an accusation. Providers do not return every field for every public profile. Some creators have strong engagement and reach with no credibility field. Some have a complete audience module and no usable growth series. InfScore's job is to keep those states visible.
When you see a dash:
- Read the other factors. They are still real.
- Read scoring coverage. That percentage is the sum of the weights that actually participated.
- Do not assume the missing row would have been high, or low. You do not know.
- If you want more of the graph, the work is on the public profile and the connected platforms, not on a form inside InfScore.
How missing factors change the composite
The composite is a weighted average of the observed factors only.
Take a concrete case from the model tests, using round numbers so the arithmetic is checkable. Suppose audience quality is missing (32% held out), engagement is 50, reach & momentum is 41, and platform strength is 45. Scoring coverage is 68, because 27 + 23 + 18 = 68. The composite is those three scores blended by those three weights, then rounded. Audience quality did not enter as a zero. It did not enter at all.
If every factor is present, coverage is 100 and the published 32/27/23/18 mix applies in full. If nothing usable is present, the score is 0 with no fantasy average behind it.
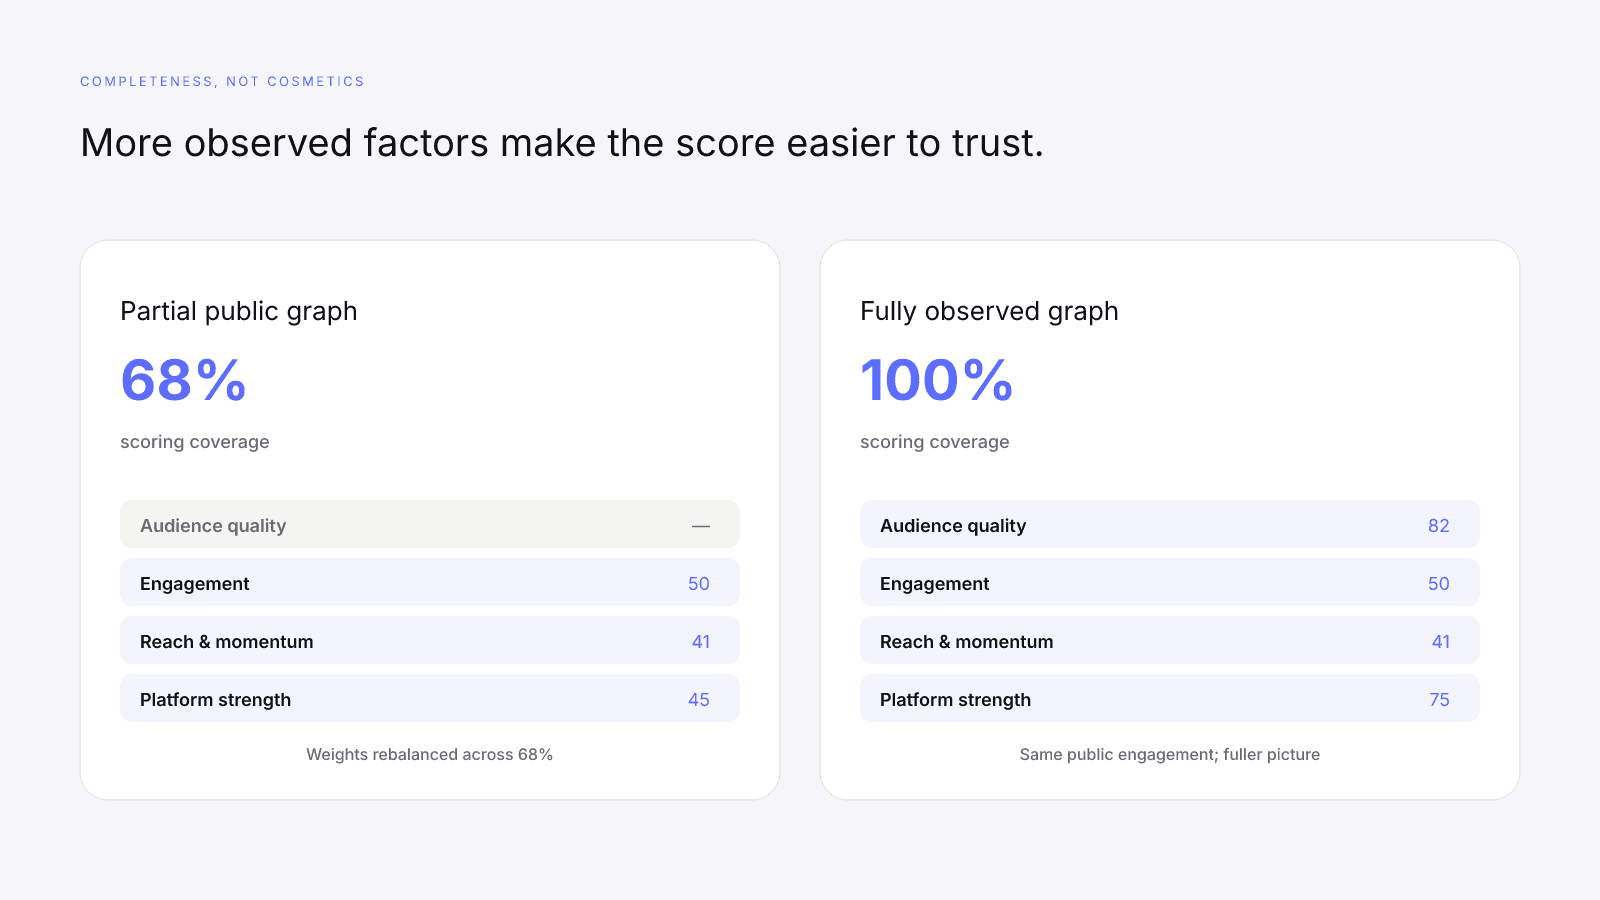
That is why two creators with the same headline engagement can have different InfScores, and why a higher number with 50% coverage is not "better" than a slightly lower number with 100% coverage. Coverage is part of the reading, not fine print.
A useful habit: when you screenshot a score, include the coverage line and the model id. A bare 72 without those two facts is an incomplete citation.
Tiers: how to read the label next to the number
The tier is a band on the same 0–100 composite. It is not a league table and not a percentile.
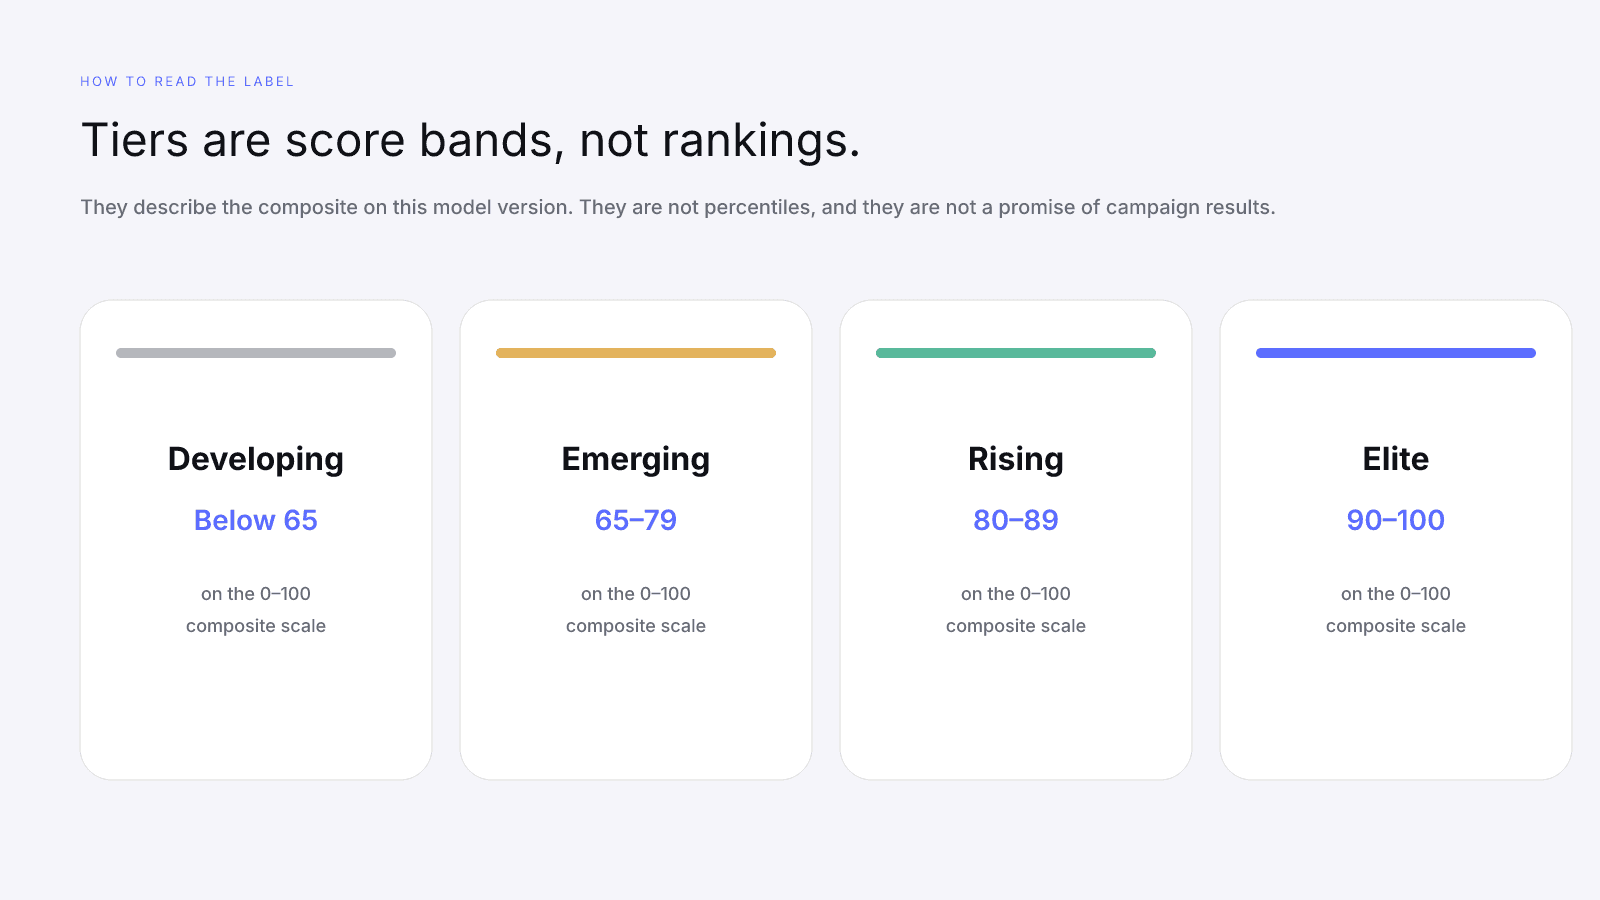
- Elite — 90 to 100
- Rising — 80 to 89
- Emerging — 65 to 79
- Developing — below 65
A creator can sit in Emerging with excellent engagement and a thin platform graph. Another can sit in Rising with broader coverage and quieter engagement. The label is a shorthand for the number you already have, on this model version.
Do not treat a jump from Emerging to Rising as a personality change. Treat it as the composite crossing 80, then look at which factor moved.
How to read your free score
The public scorecard is intentionally thin. That is not a teaser for its own sake. The free view keeps InfScore identity, the four factors, and headline reach. It omits the dense provider modules so they cannot leak into a page you did not pay for.
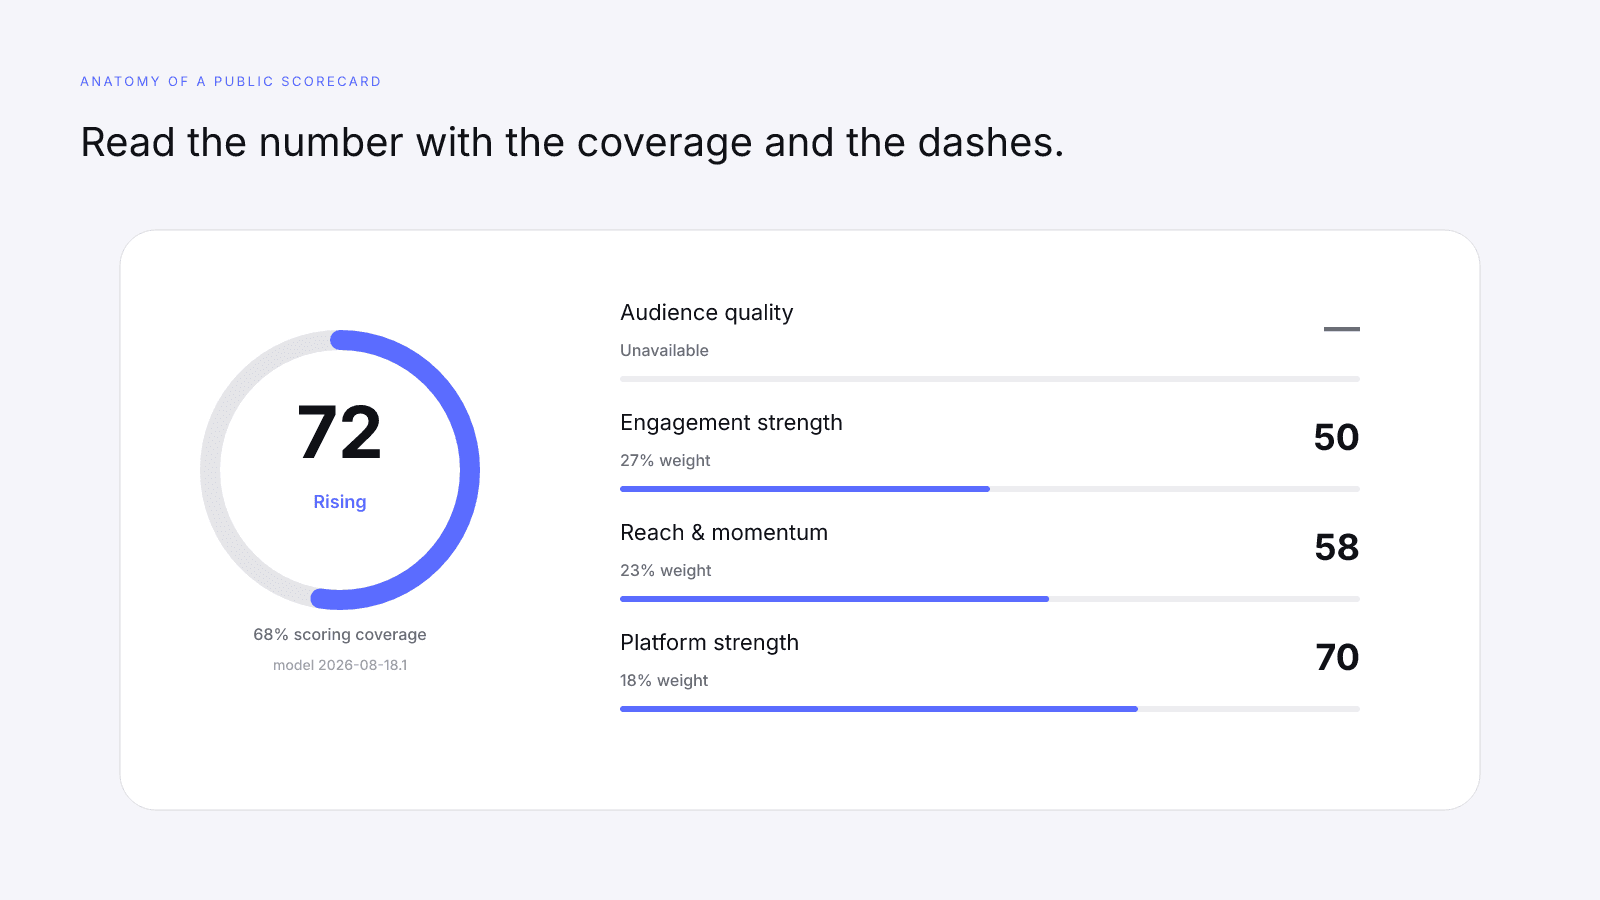
Read it in this order:
- The 0–100 number and tier. This is the composite from observed factors only.
- Scoring coverage. How much of the 32/27/23/18 model participated.
- The four rows. Note dashes. A dash is missing data shown.
- Headline followers and engagement. These are public totals when available, not the full analytics package.
- Model version. Same formula, same comparison; different version, different conversation.
- Primary platform. The lookup used a specific network. Connected platforms may still appear in platform strength when the provider returns them.
For a live example of that layout, open the MrBeast YouTube score. Example cards on the homepage are illustrative; a score URL is the product.
If the page is yours, you can claim the profile after proving control of the matching account. Claiming does not rewrite the public formula. It attaches the score to someone who can actually manage it.
What the $0.99 report adds
The public InfScore stays free. The denser report is a one-time $0.99 unlock, not a subscription. Pricing is one report, one dollar, no recurring fee.
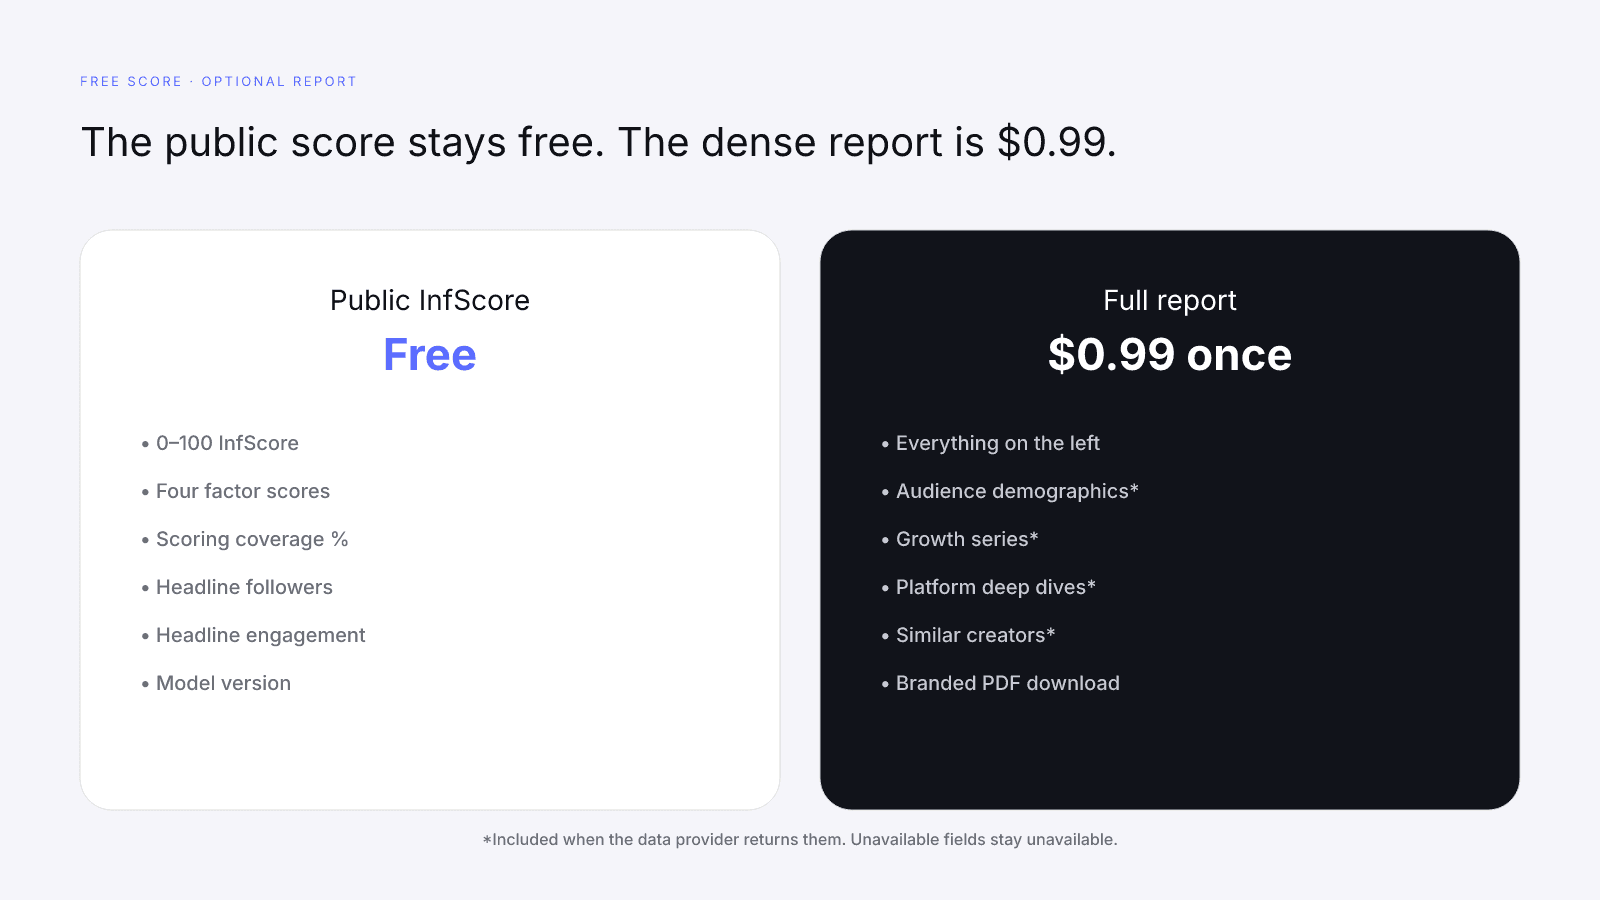
The paid report is the same creator and the same composite, plus the provider modules when they exist: audience demographics, growth series, platform deep dives, similar creators, and a branded PDF. Fields the provider did not send stay unavailable there too. Paying does not purchase invented rows.
Use the paid report when you need to explain the score to someone else (a manager, a sponsor, yourself on a planning day). Use the free score when you need the comparable number quickly. Both views are honest about gaps. The paid view is simply denser.
Create an account if you want past purchases kept in My InfScore. You can still view any public score without one.
Ethical ways to improve each factor
InfScore does not offer a back door. The only way the number moves is if the public signals move. Below is the work that is actually in your control, mapped to the factor it can affect.
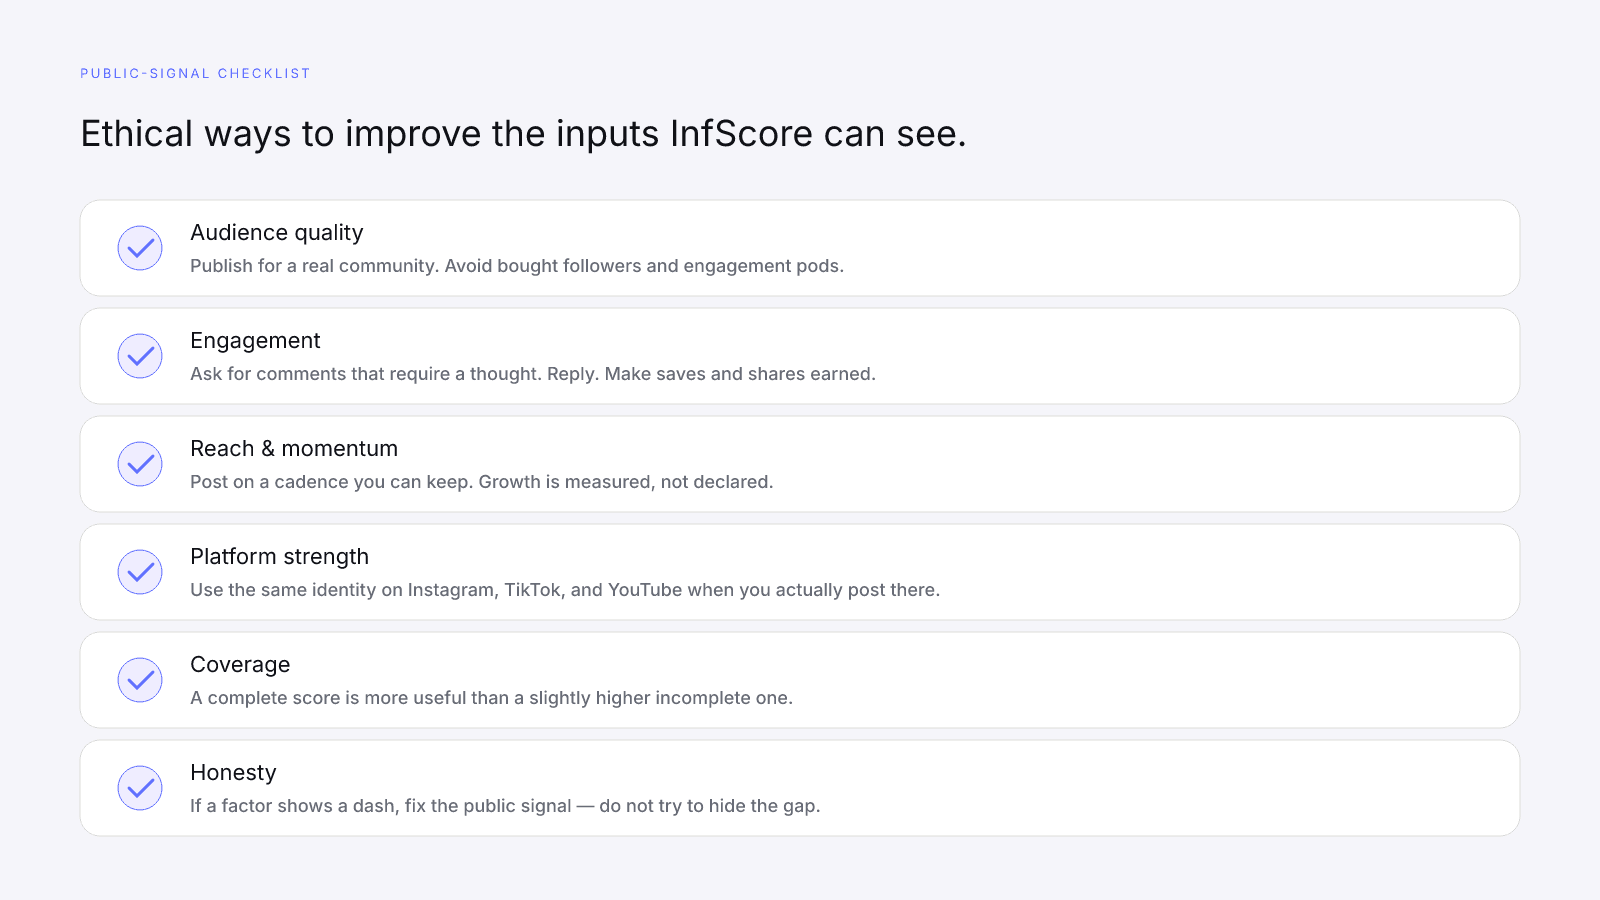
Audience quality. Stop renting attention. End follower giveaways that attract accounts with no interest in the next ten posts. Collaborate with creators whose audience would watch you even without a prize. If you inherited a bloated graph from years of follow-for-follow, you will not clean it overnight; you can stop adding to it.
Engagement. Write prompts that require a specific answer. Reply while the thread is still alive. Publish some posts that are useful enough to save. Watch the public engagement rate over a normal month, not a single spike. If a format never earns a conversation, retire it.
Reach & momentum. Consistency beats a once-a-quarter dump, because growth is a measured input. Expand to a second platform only when you have something to publish there. Do not confuse a trending sound with momentum you can keep.
Platform strength. Connect the identities you actually use. Matching handles and bios help a provider resolve Instagram, TikTok, and YouTube as one creator. Do not stand up a third platform as a placeholder. Coverage floors reward observed audiences, not reserved usernames.
None of this requires disclosing private analytics to InfScore. The product is scoring what is already public.
What will not raise your InfScore
Skip these. They waste money and they usually make the public graph worse.
- Buying followers, likes, comments, or views.
- Comment pods and engagement circles designed to manufacture ratios.
- Private-account tricks meant to hide a weak graph while keeping a public handle searchable.
- Stuffing three networks with identical unused profiles to look cross-platform.
- Arguing that a dash should be treated as a high score because you "know" the audience is real.
InfScore will not publish a secret recovery score for people who did those things. If the public signals improve later, the versioned model will pick that up the next time the profile is fetched. If they do not, the number should stay put.
A practical public-signal checklist
Use this as a working list, not a ritual.
- Search yourself on InfScore the same way a stranger would.
- Write down the composite, coverage, model id, and any dashed factors.
- For each dashed row, ask whether the public profile actually exposes that signal.
- For each scored row, change the public behavior above (audience, posting, cadence, connected platforms) rather than the page on InfScore.
- Re-check after you have shipped a normal month of work, not after one post.
- If you need the denser modules, unlock the report once. If you do not, the free score is the product.
The honest version of improving your InfScore is improving the public creator graph that anyone can already see. The score is just the part that holds still long enough to compare.
Try a free public score on infscore.com. If you want the modules behind a specific profile, the full report is there for $0.99, and only when you actually need it.
FAQ
What is InfScore in one sentence?
InfScore is a versioned 0–100 composite score for public Instagram, TikTok, and YouTube profiles, built from four published factors and only the provider signals that actually exist.
What are the four InfScore factors and their weights?
Audience quality is 32 percent, engagement is 27 percent, reach and momentum is 23 percent, and platform strength is 18 percent. Those displayed weights are the weights the current model uses.
What does missing data shown mean on an InfScore?
If a provider does not return a factor input, InfScore displays that factor as unavailable instead of inventing a value. The composite is then rebalanced across the remaining observed factor weights, and scoring coverage shows how much of the model was available.
Does a dash on a factor count as a zero?
No. A dash is a gap in the data. That factor's weight is held out of the composite. Treating missing data as zero would punish creators for a provider gap, which is the opposite of the design.
Is the free InfScore different from the $0.99 report?
The free score is the same 0–100 composite, four factors, coverage percentage, and headline reach. The one-time $0.99 report unlocks the denser provider modules when they exist, including audience, growth, platform deep dives, and a branded PDF.
Can I raise my InfScore by buying followers or engagement?
That usually works against you. Bought audiences and engagement pods tend to weaken credibility and produce engagement that does not hold up as a public signal. InfScore is built from observed public data, not from self-reported claims.
Where can I see a live public score?
Search any public creator from the InfScore homepage. For a worked example of the public scorecard, open the live MrBeast YouTube score. The public score does not require an account.