YouTube Momentum Signals Creators Underuse
YouTube reach & momentum is 23% of InfScore. Learn which public growth and consistency signals creators underuse — and why subscriber vanity is not momentum.
This versioned composite uses only available public signals. Missing factors stay unavailable and their weight is rebalanced across observed factors. It is not a percentile, price estimate, or guarantee of campaign results. Model 2026-08-18.1.
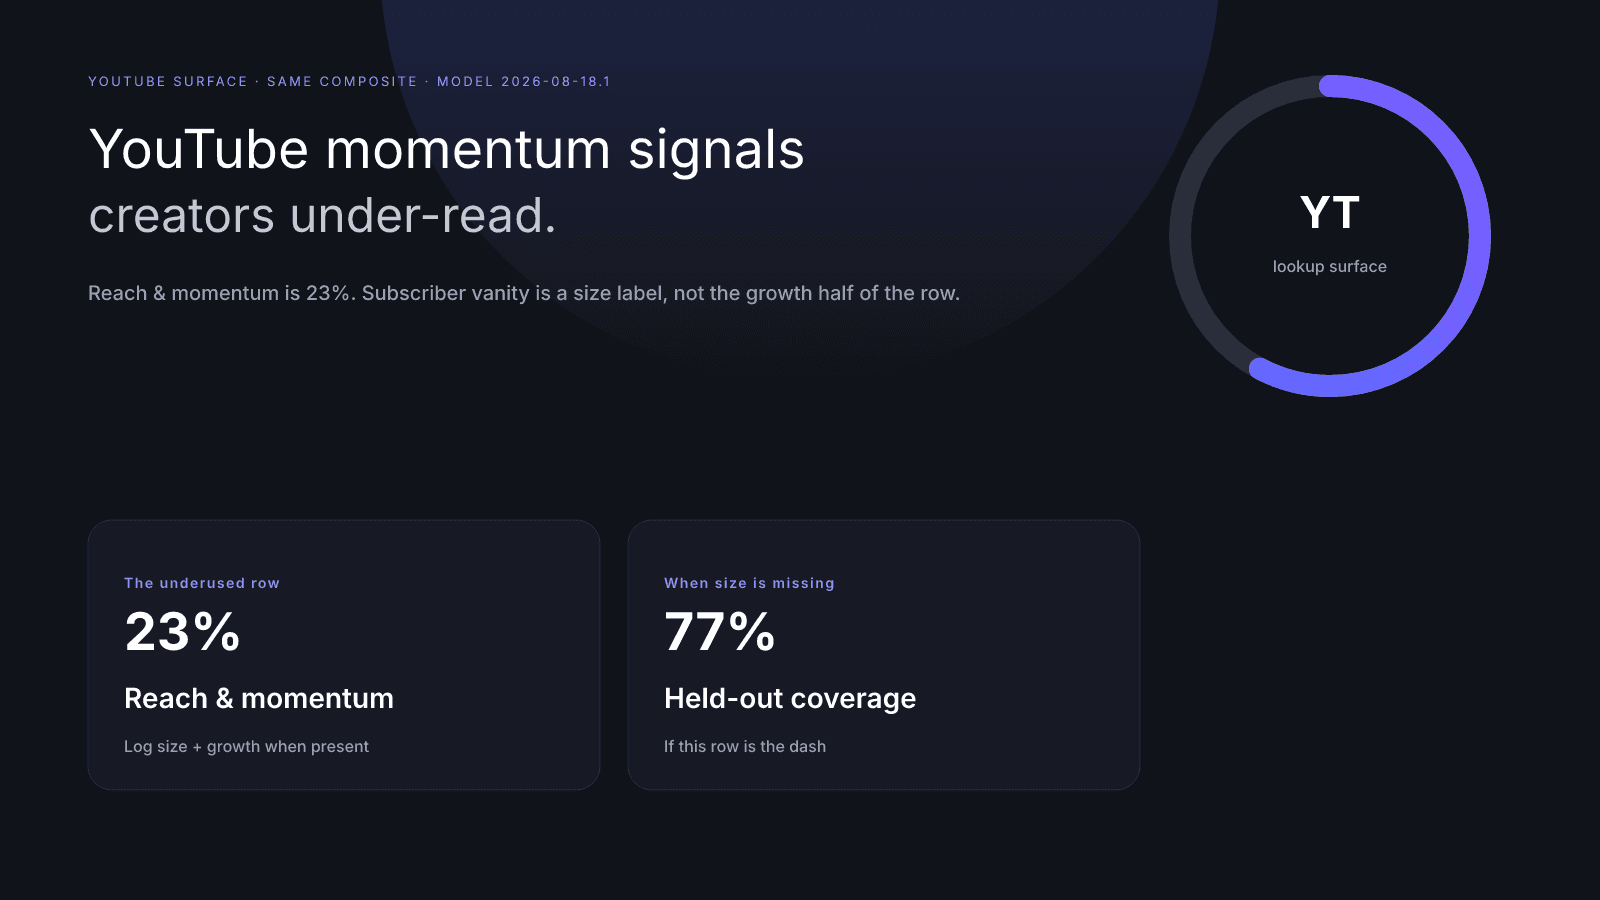
YouTube is a platform surface of the same InfScore, not a separate formula. On model 2026-08-18.1 the published mix is still audience quality 32%, engagement 27%, reach & momentum 23%, and platform strength 18%, scored from public YouTube-facing creator signals. Private YouTube Analytics, Suggested, and Shorts-boost myths do not move the free score. Creators often underuse the public growth and consistency half of that 23% row and over-read raw subscriber count. Huge subs alone do not mean momentum won. This guide shows which public YouTube-facing signals feed momentum, what a dash means, and how to read the row without fake stats. For the four-factor tour, start with How to Measure Influencer Performance.
Same InfScore, YouTube-facing inputs
Search a public YouTube profile on infscore.com and you get the same free 0–100 composite as an Instagram or TikTok lookup. No account is required. There is no separate YouTube-only formula. The scorecard still shows four independently calculated rows, scoring coverage, and the model id. The platform you typed is the surface. It is not a fork of the math.
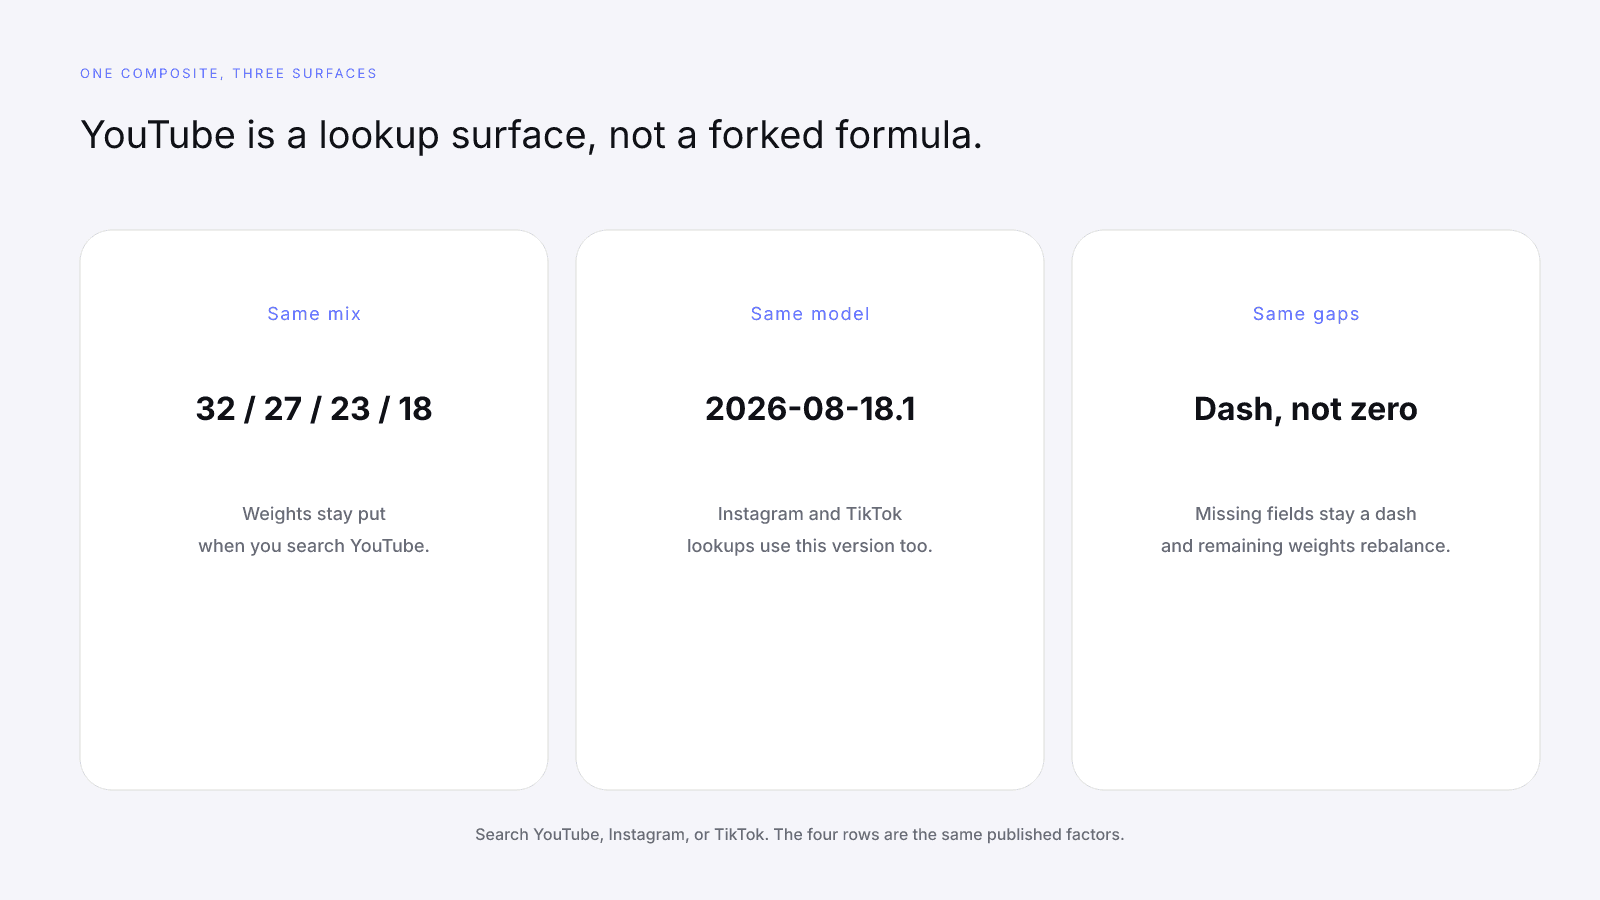
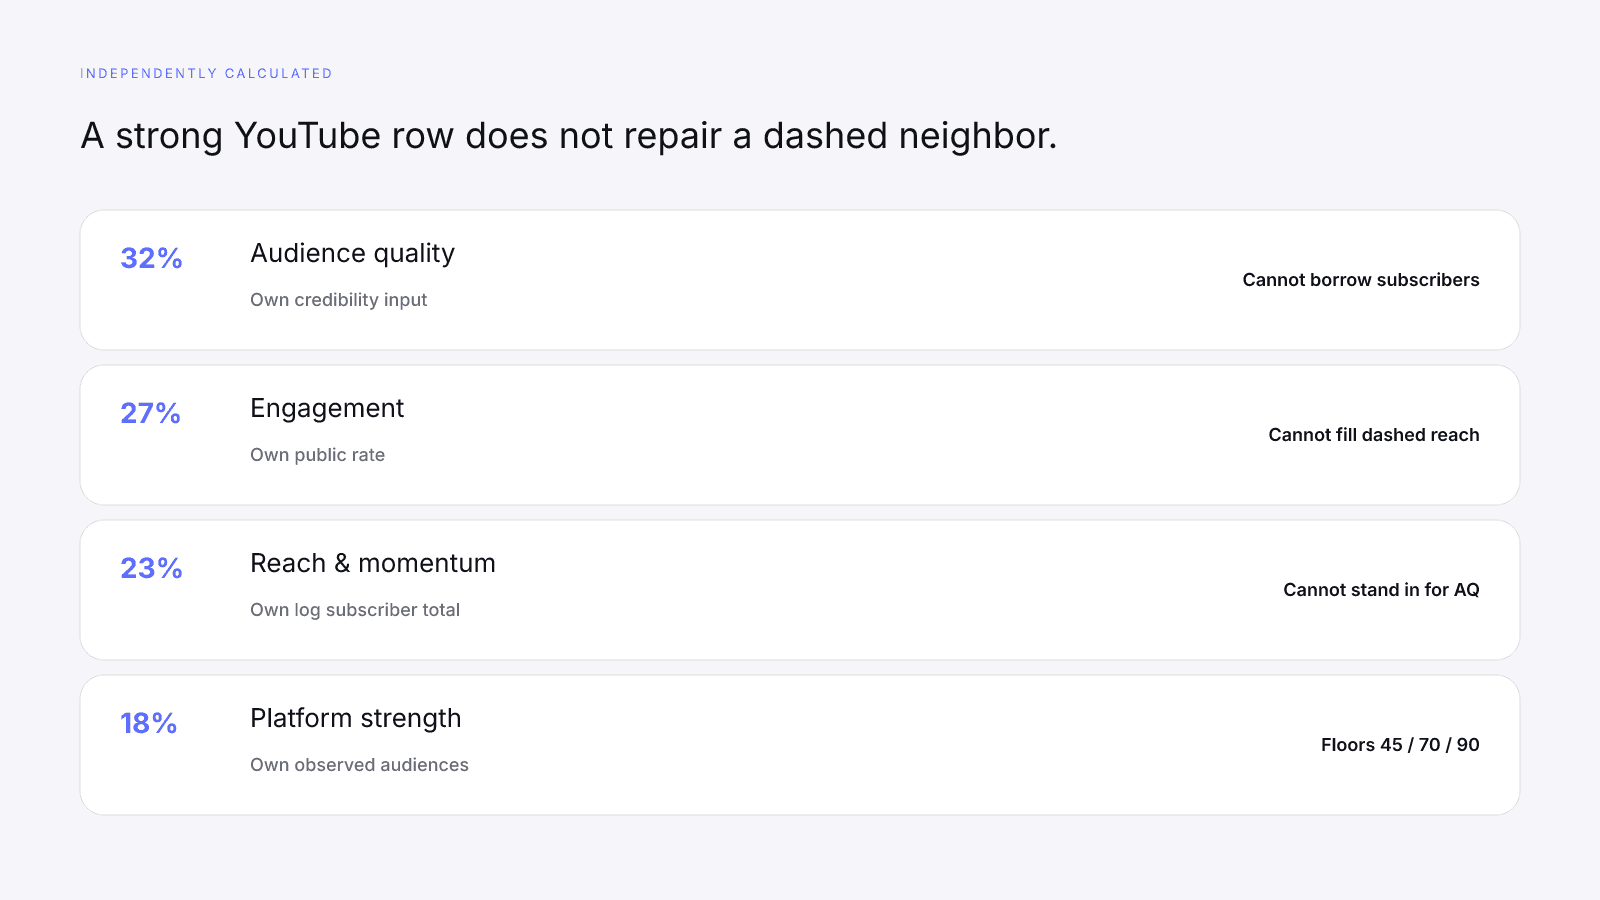
Brands still ask which YouTube number "matters more," as if Studio kept its own weights. It does not. The displayed mix is the mix the current model uses: audience quality 32%, engagement 27%, reach & momentum 23%, platform strength 18%. Independently calculated still applies. A loud YouTube engagement row cannot lend points to a missing momentum input, and a huge subscriber total cannot invent an engagement rate.
What does change is which public creator signals sit behind those rows when YouTube is the profile you searched:
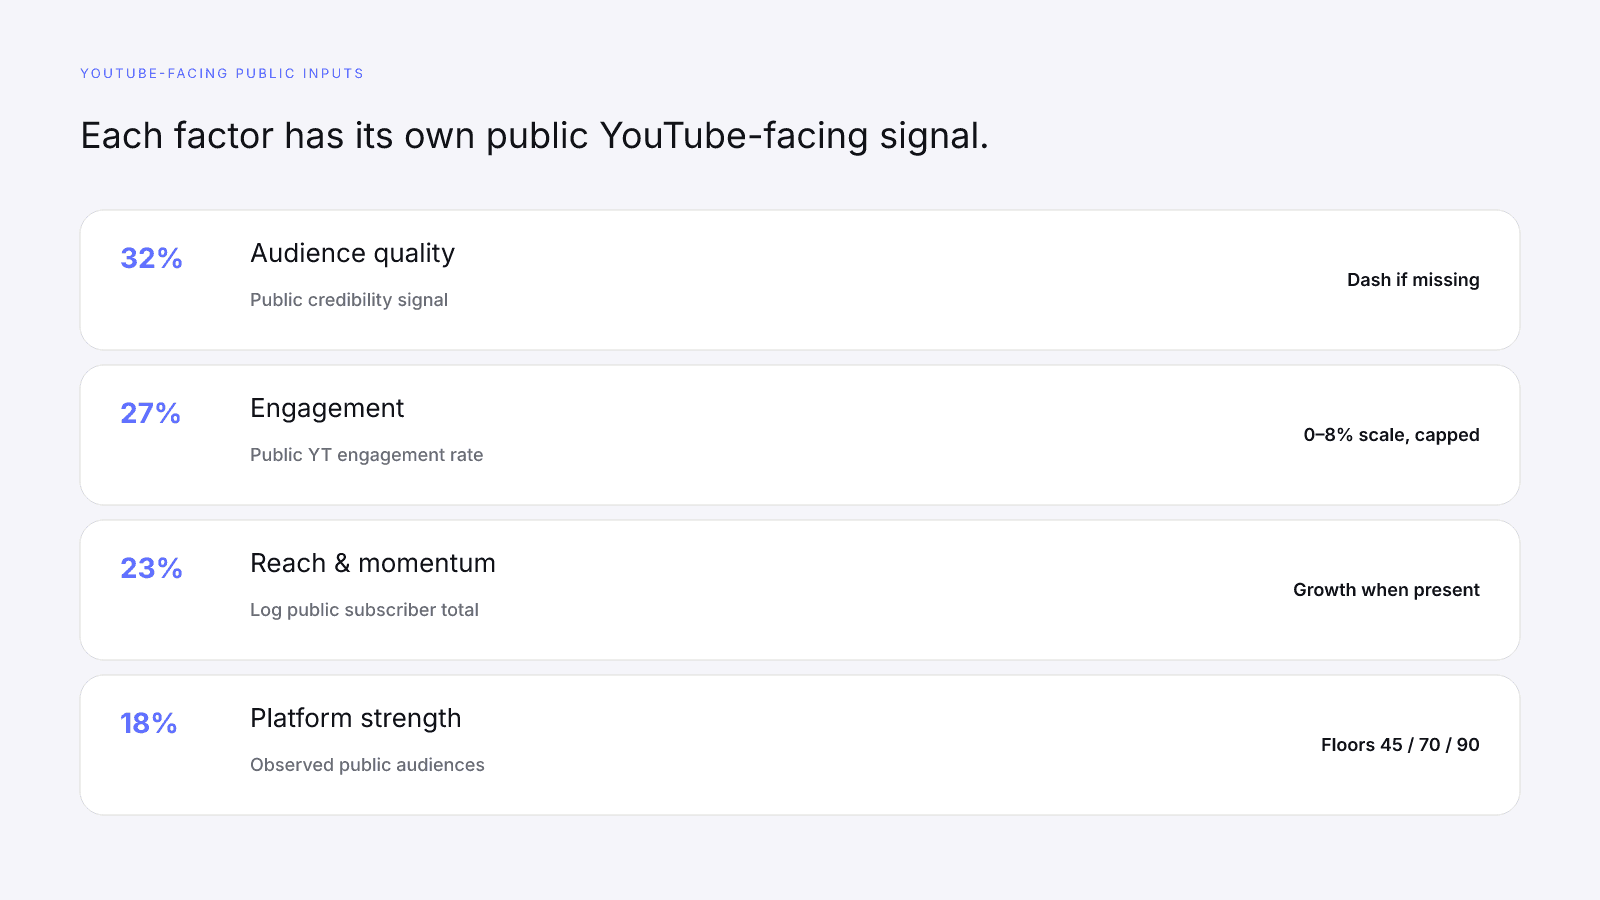
| Factor | Weight | YouTube-facing public input |
|---|---|---|
| Audience quality | 32% | Provider-measured audience credibility when that signal exists |
| Engagement | 27% | Public YouTube engagement rate, mapped onto a fixed 0–8% scale |
| Reach & momentum | 23% | Logarithmic public subscriber total, blended with growth when available |
| Platform strength | 18% | How many public audiences were observed, and whether they are badly lopsided |
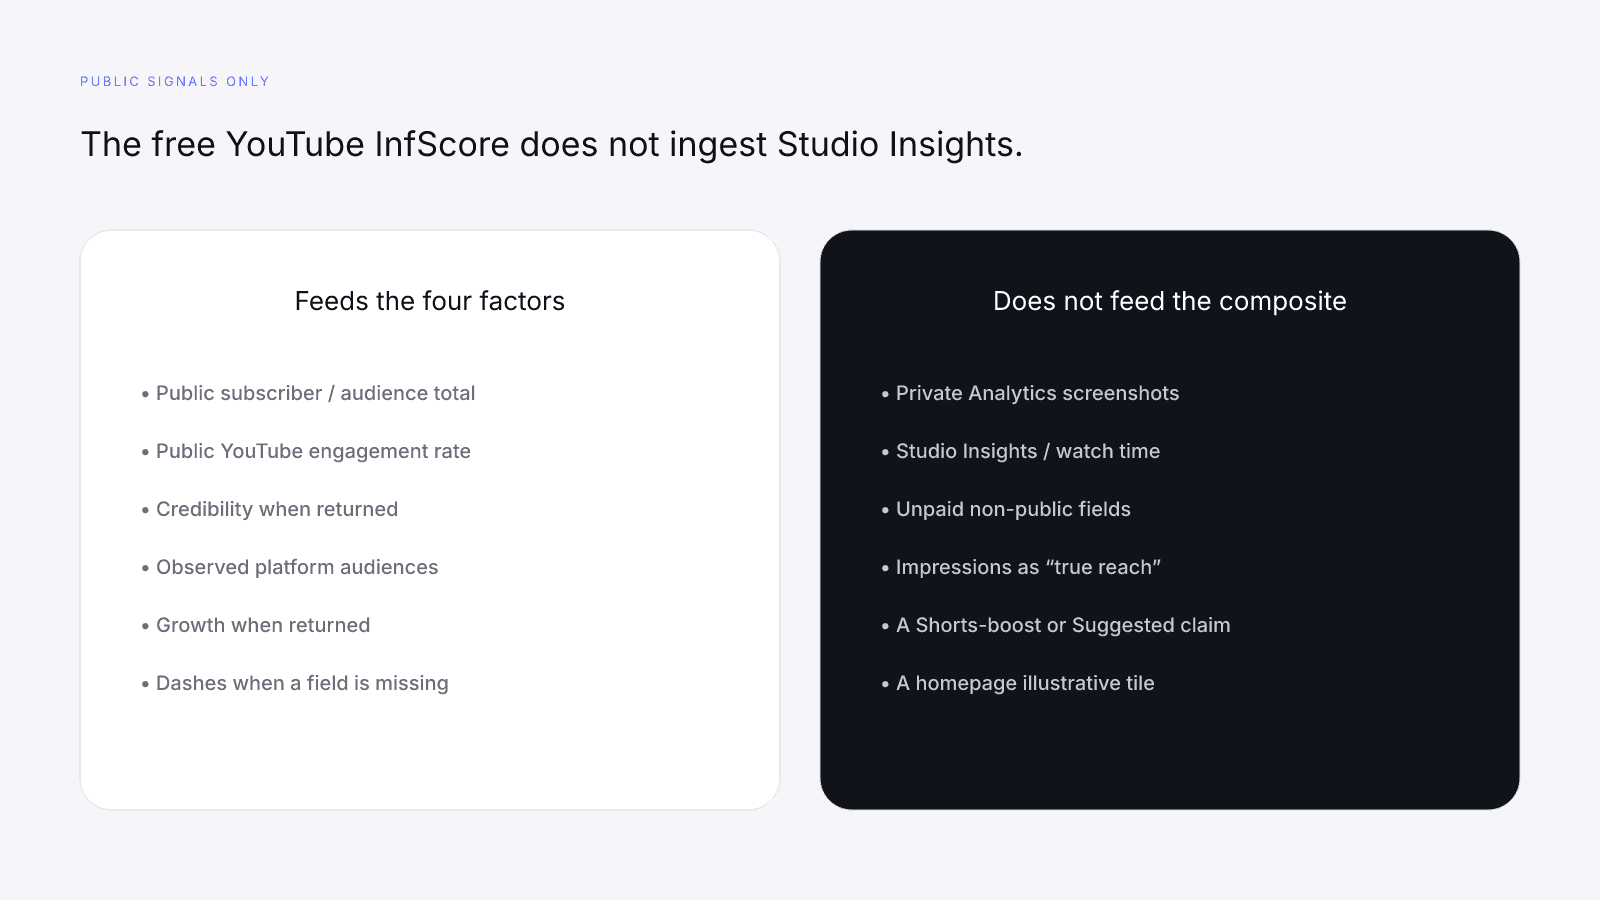
Those inputs are public provider data: not a dump of YouTube Analytics, not Studio Insights, and not a creator-uploaded CSV. If a field is missing, the factor is a dash. The missing weight is held out. Remaining observed weights are rebalanced in their published proportions. See Missing Data on Creator Metrics for the coverage arithmetic.
Reach still sums observed public audiences. If the provider also returned Instagram or TikTok for the same creator, those follower totals join the reach input. Platform strength counts how many of those graphs were observed. YouTube-only lookups still run the same four rows; they just sit on a thinner platform graph. That is a coverage fact, not a verdict that posting on one network is a mistake.
The worked public card for this guide is MrBeast on YouTube. Open that URL and read coverage first. If audience quality is dashed, the 32% weight is held out. If the denser growth series is locked or missing, the 23% row can still score from logarithmic public size: that is a thinner momentum input, not a fill. Do not invent a growth percentage from the subscriber screenshot. Example cards on the homepage are illustrative; a score URL is the product. For the same composite on a different surface, see Emma Chamberlain on Instagram or Khaby Lame on TikTok, not a different YouTube formula. The Instagram-facing map is Instagram InfScore Factors. The TikTok comparison is TikTok Reach vs Engagement.
What "momentum" means on the scorecard
Reach & momentum is one published row. People split it in their heads anyway, then treat the subscriber screenshot as the whole thing.
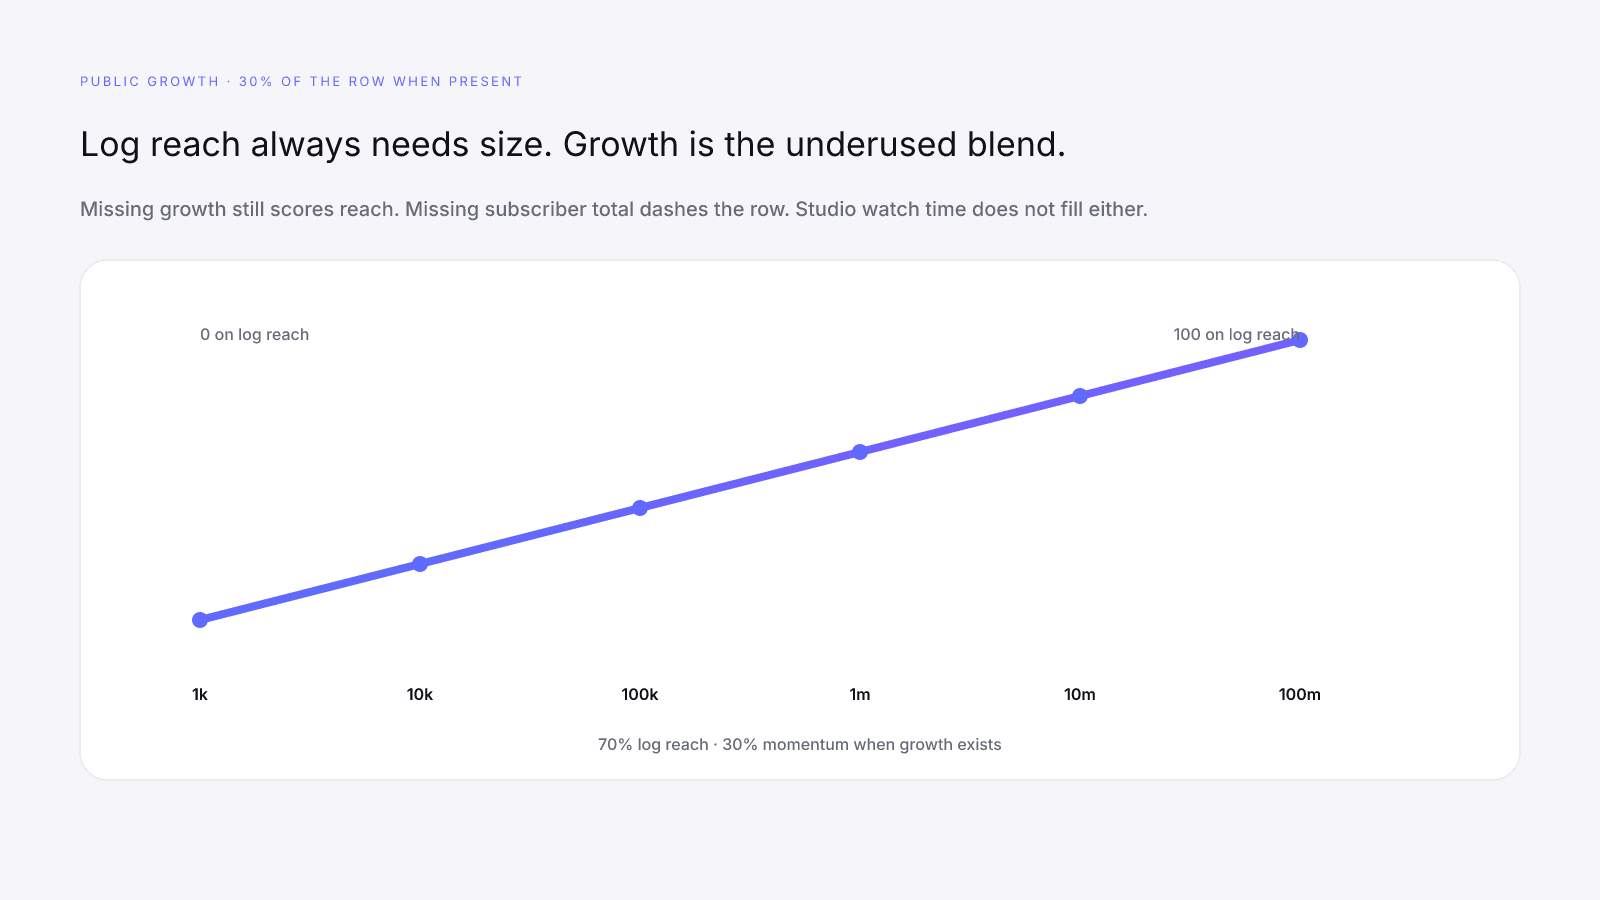
Reach is logarithmic public audience size. On the current model it runs from about 1,000 public subscribers or followers (0 on that piece) through 100 million (100). YouTube subscriber vanity does not move this piece one-for-one. The log scale compresses the gap between a large channel and a gigantic one, and it keeps mid-size creators on the same chart.
Momentum is the optional half. When a public growth or consistency signal exists, the factor becomes a blend: 70% logarithmic reach and 30% momentum. Momentum is a bounded transform of that growth signal. If growth is missing, reach still scores on its own. Growth is the optional 30% blend, not a veto on the row.
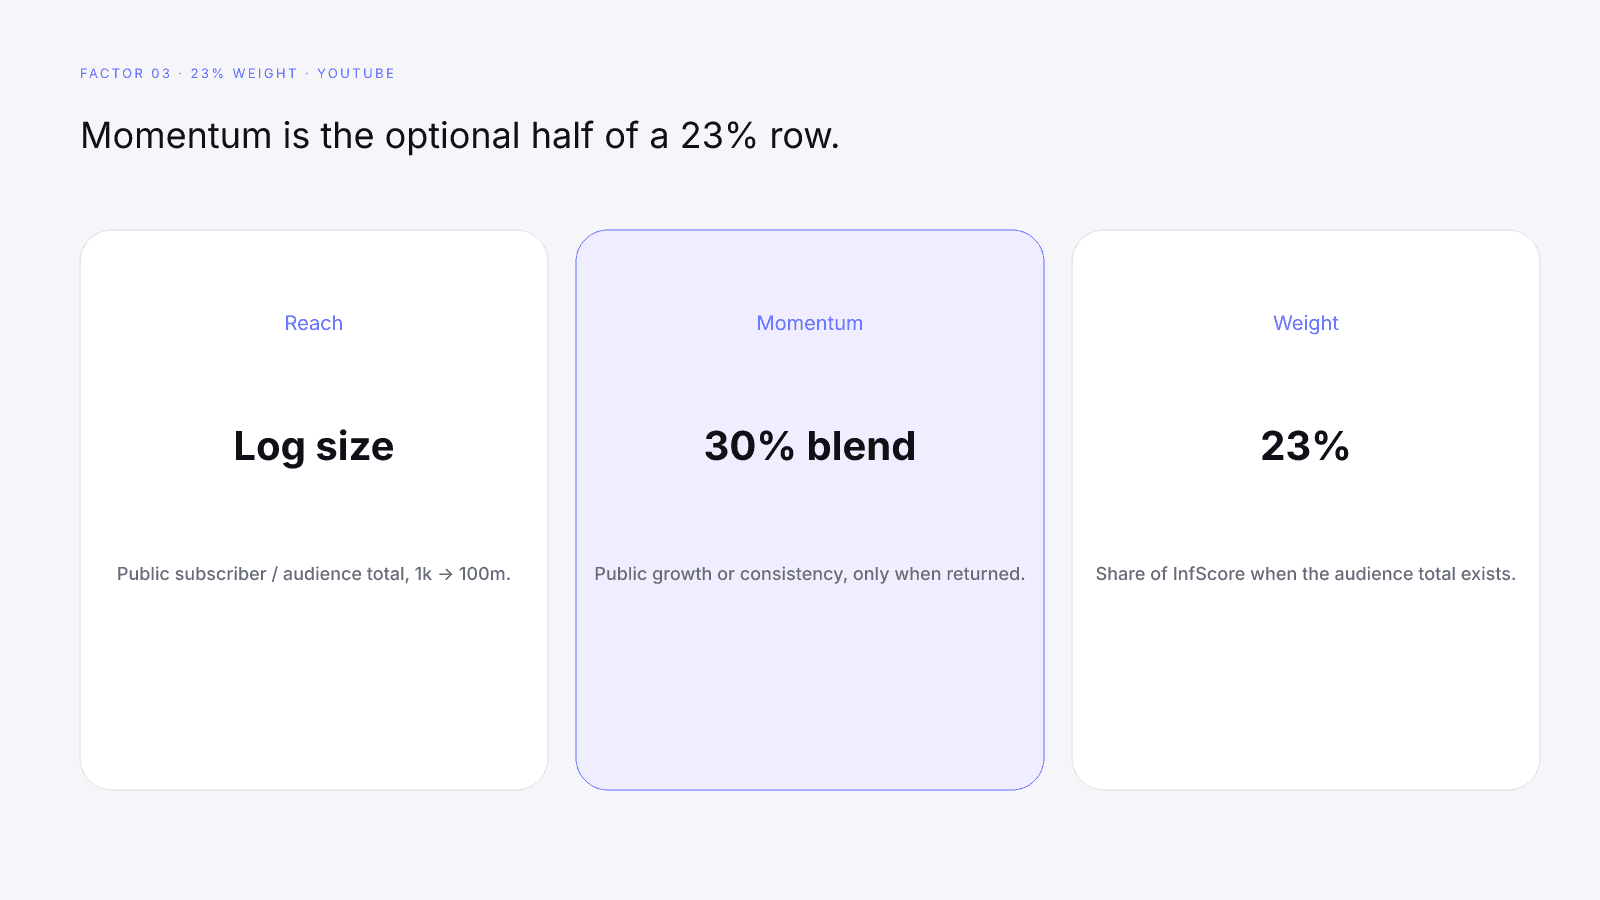
The factor is 23% of InfScore when the public audience total exists. That 23% is weight in the mix. It is not a trophy for the subscriber line, and it is not a promise that last month's upload cadence "won."
The input is the public audience total InfScore can actually see. When YouTube is the only observed audience, that total is the YouTube subscriber count. When the provider also returned other public graphs for the same creator, those counts are summed. A platform the provider did not return does not add to the total.
None of this replaces audience quality at 32% or engagement at 27%. Those rows still run when their inputs exist. Reading momentum while cropping the rest of the card is the same trap as screenshotting one green line. How to Read an Influencer Scorecard is the full reading order: coverage, dashes, independent rows, then the composite.
If the public audience total is missing or not usable, the whole reach & momentum row is a dash. You cannot call momentum strong or weak. You can only say the row did not run.
Public signals creators underuse
The underused half is not a secret Studio tab. It is the public growth and consistency signal, when the provider actually returns it.
Creators screenshot subscribers because the number is on the channel. Growth rate and posting consistency, when they exist as public provider fields, sit one click further away. InfScore will use them for the 30% momentum blend. It will not invent them from a "I post twice a week" line in a media kit, and it will not scrape private Analytics to fill the gap.
What that means in practice:
- Growth present. The row is 70% log reach and 30% the bounded growth transform. A rising public audience can lift the factor without pretending 80 million subscribers are eight times 10 million.
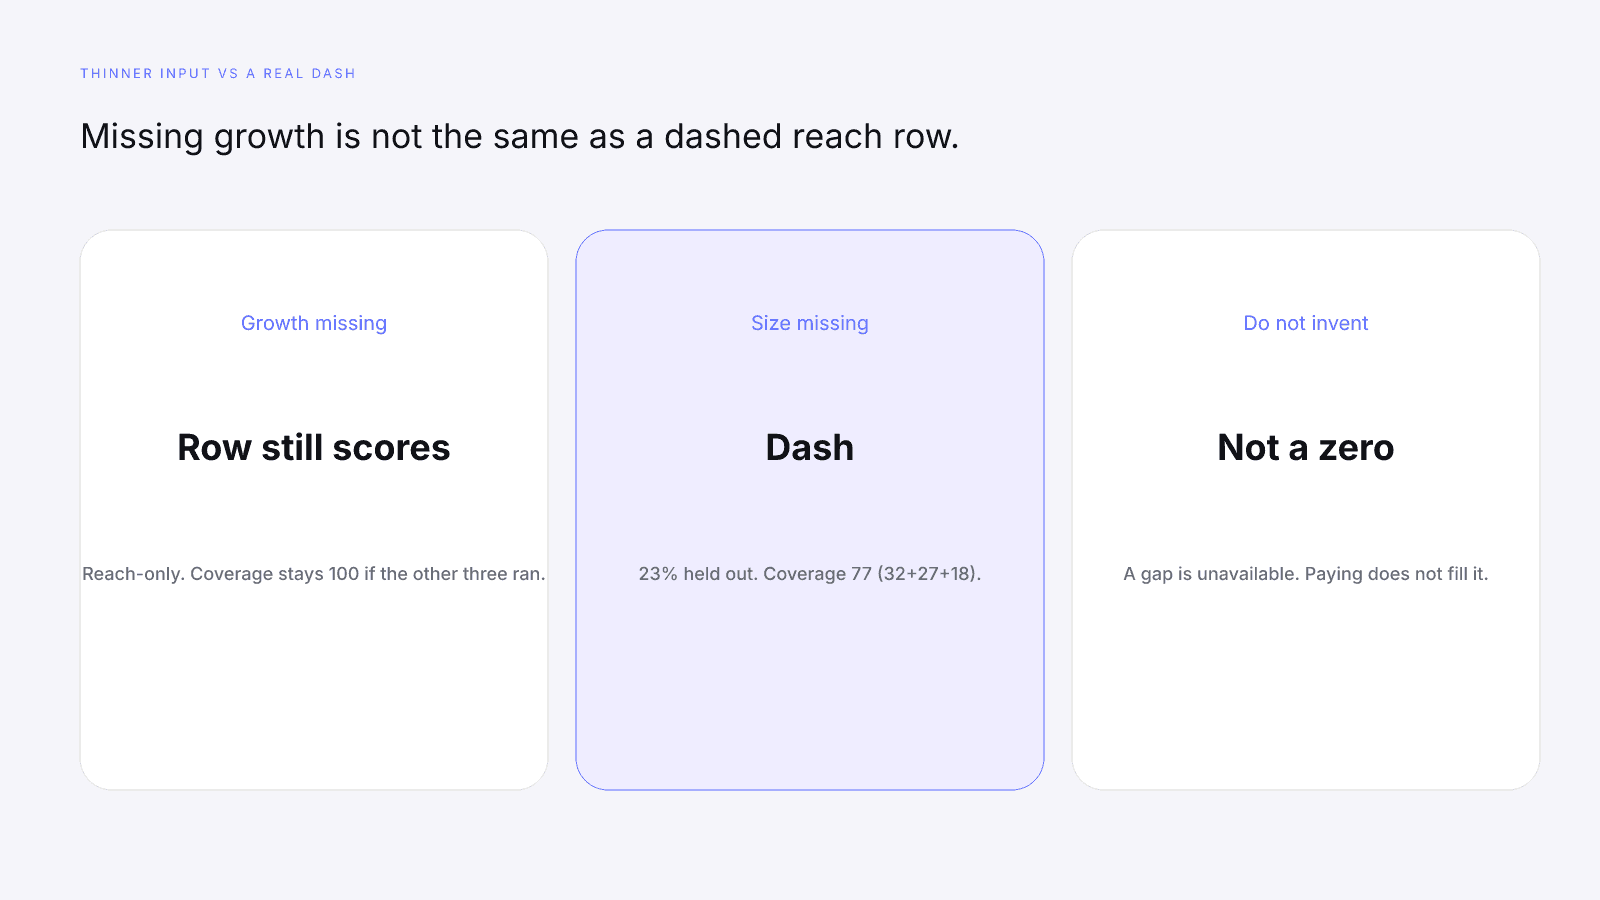
- Growth missing. Logarithmic reach still scores. The 30% blend never runs. The row is thinner, not dashed, as long as the public subscriber or audience total exists.
- Audience total missing. Then the factor is a dash. Coverage falls by 23, to 77 (32+27+18). Missing growth did not cause that dash. Missing size did.
InfScore will not estimate "true YouTube reach" from impressions it cannot see. Views, watch time, average view duration, click-through, and Suggested placement live in denser provider modules when they exist. They are not smuggled into the free composite. A Studio screenshot of "watch time last 28 days" does not rewrite this row.
Consistency, in this model, is not a moral grade for showing up. It is whatever public growth or cadence signal the provider returned. If that field is blank, the honest state is the thinner reach-only blend, or the dash if size itself is gone. Do not backfill it with a posting calendar you typed into a pitch deck.
Subscriber vanity vs momentum
Headline subscriber count is a size label. Reach scores that size on a log scale as 23% of the model. Audience quality scores credibility as 32%. Engagement maps a public rate onto a published 0–8% scale as 27%. Mixing those into one vanity screenshot is how a stagnant mega-channel passes a first glance.
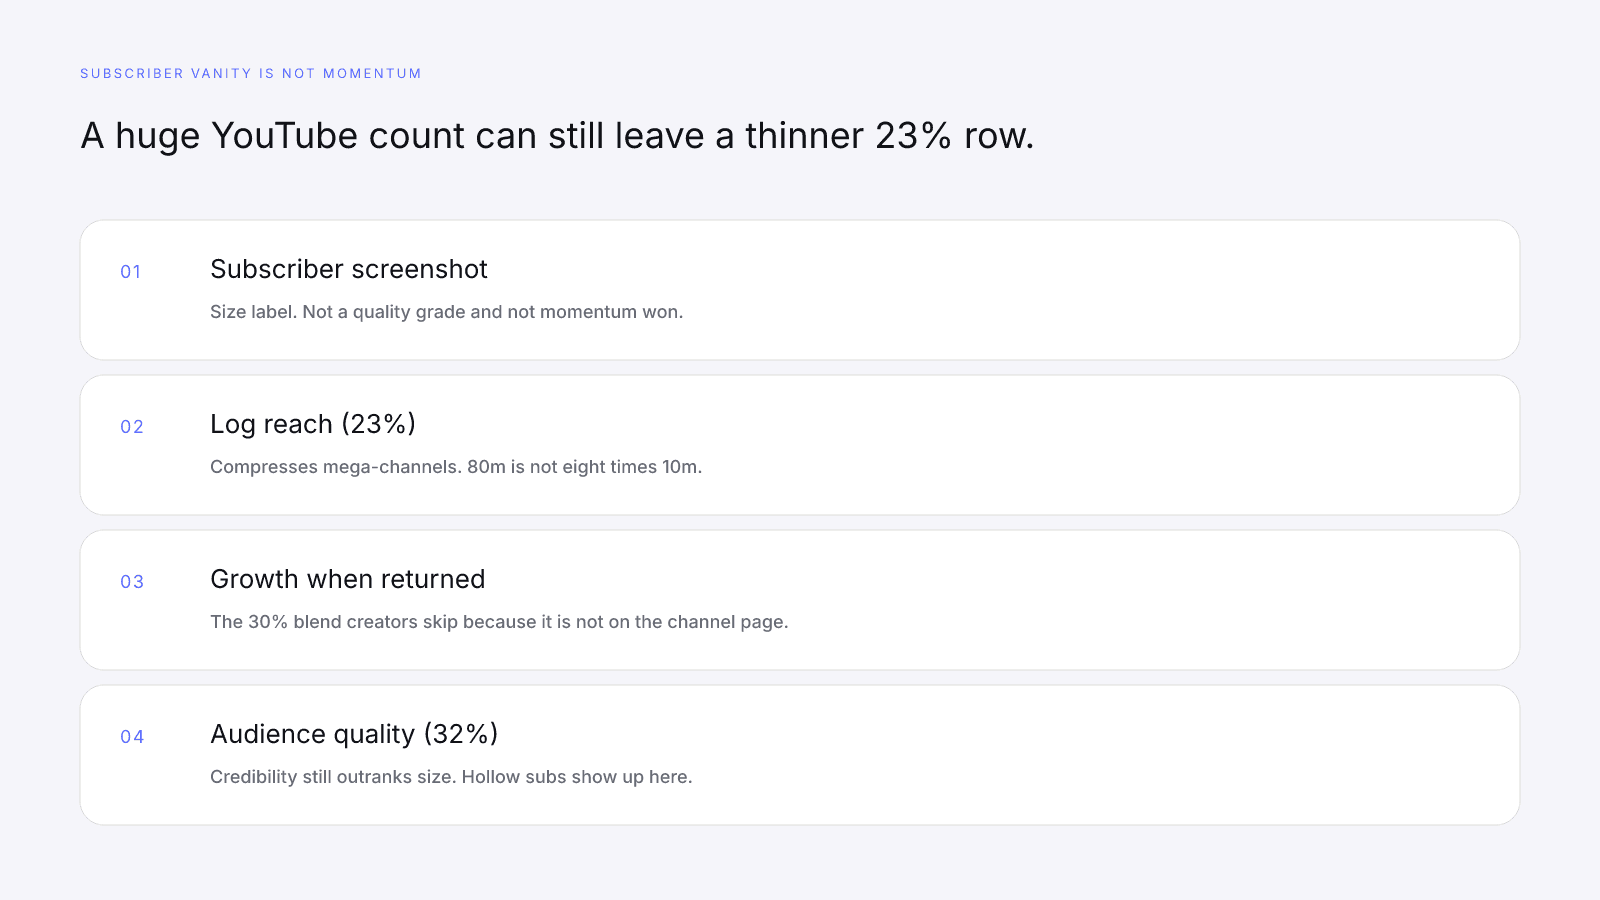
A huge subscriber total can still produce a weaker reach & momentum row than you expect, because:
- The log curve already compressed the jump from tens of millions to hundreds of millions.
- Growth is missing, so the 30% momentum blend never ran.
- The public total InfScore can see is smaller than the screenshot, because another platform graph was not returned.
- Audience quality is the heavier row. Hollow or mismatched subscribers tend to show up there, not as a bonus on size.
Read that twice if you have been taught that more YouTube subscribers always win. InfScore still moves as public reach grows. It will not treat a bought spike as a credibility upgrade, and it will not treat subscriber count alone as "momentum won." Size and quality stay on separate rows. The longer split is Audience Quality vs Follower Count.
Engagement is the other common mix-up. A busy comment ratio on a small public audience can outscore the log-reach row. That does not mean reach "lost." It means the two 0–100 scores differed. Weight does not rescue a weaker row. 23% of a lower score is still a lower score on that line. The dedicated engagement guide is What a Good Engagement Rate Looks Like in 2026.
Reading the row with coverage and dashes
Put scoring coverage next to the reach & momentum row before you argue about subscribers.
If every factor is present, coverage is 100 and the 32/27/23/18 mix applies in full. If reach & momentum is the only missing factor, coverage is 77. If engagement is the only missing factor, coverage is 73. If audience quality is the only missing factor, coverage is 68. If platform strength is the only missing factor, coverage is 82.
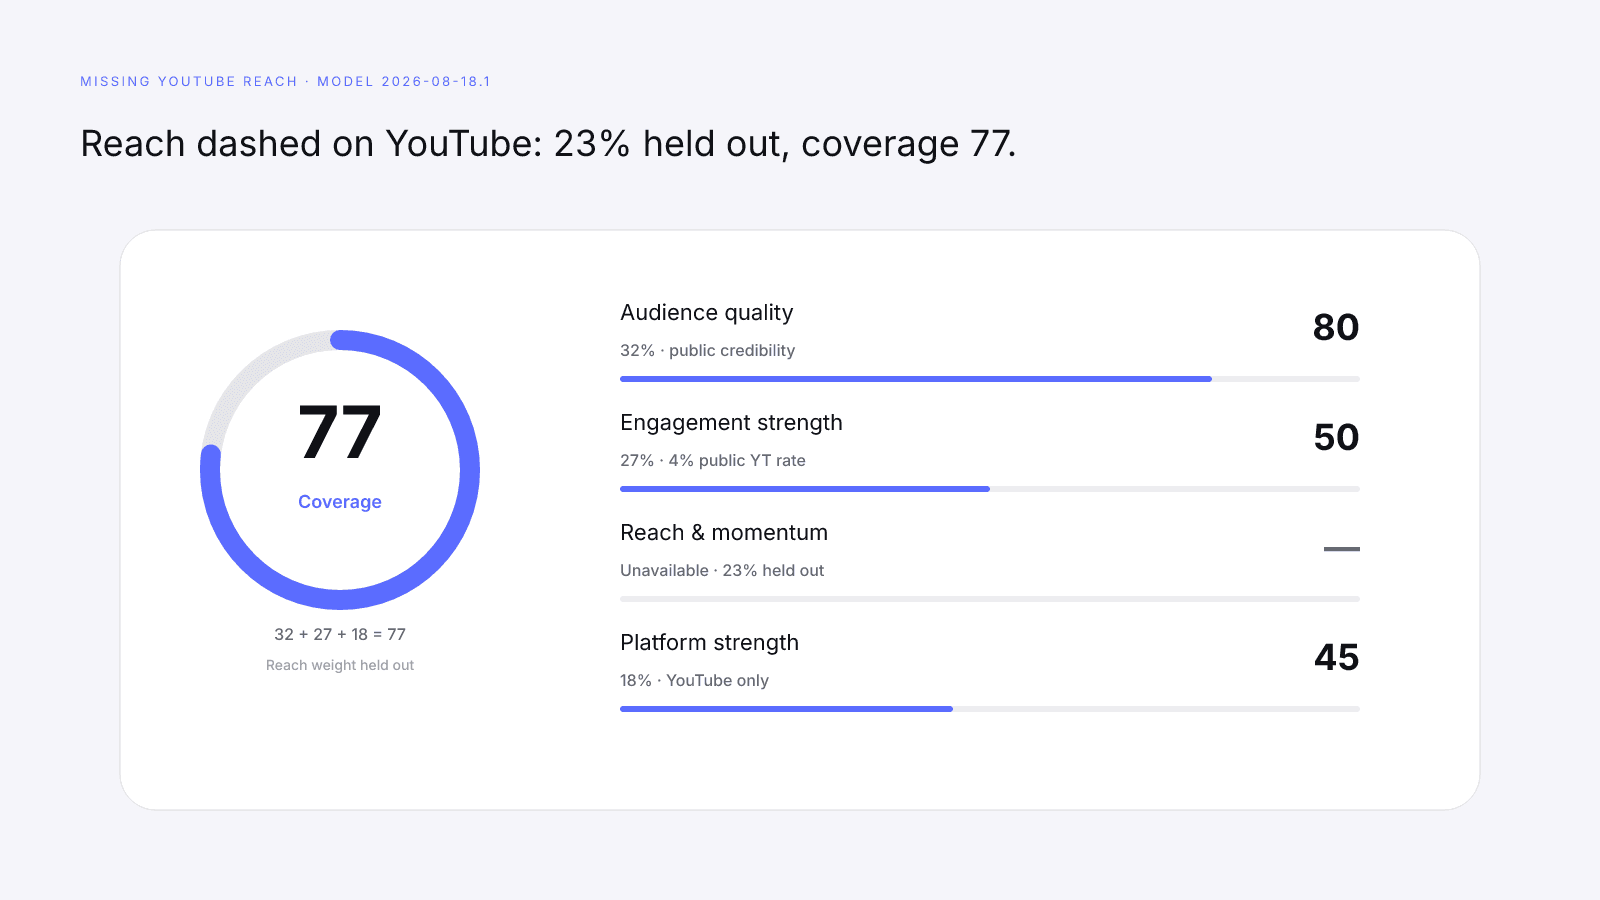
A dash is a gap in public provider data. Treating it as zero punishes a blind spot. Treating it as 100 invents a perfect row. Independently calculated means the present rows stay themselves. They do not stand in for missing growth, and they do not invent a subscriber total.
A checkable case from the model tests, using round numbers: audience quality missing, engagement at 4% public rate (50 on the factor), reach & momentum 40, platform strength 45. Coverage is 68. The remaining mix is 27/68, 23/68, and 18/68. The composite is (50 × 27 + 40 × 23 + 45 × 18) ÷ 68, which rounds to 45. On that card, reach & momentum is 40. It is not the InfScore. Paying does not fill the audience-quality dash, and it does not turn 40 into a subscriber brag.
If growth is the only thing missing, do not look for a second dash. The row still has a number. Name that it is reach-only. Coverage stays 100 if the other three factors ran. The honesty is in the thinner input, not in a fake zero on momentum.
What does not count as momentum
A lot of YouTube metrics feel like they should prove the channel is "moving." Most of them never enter this row.
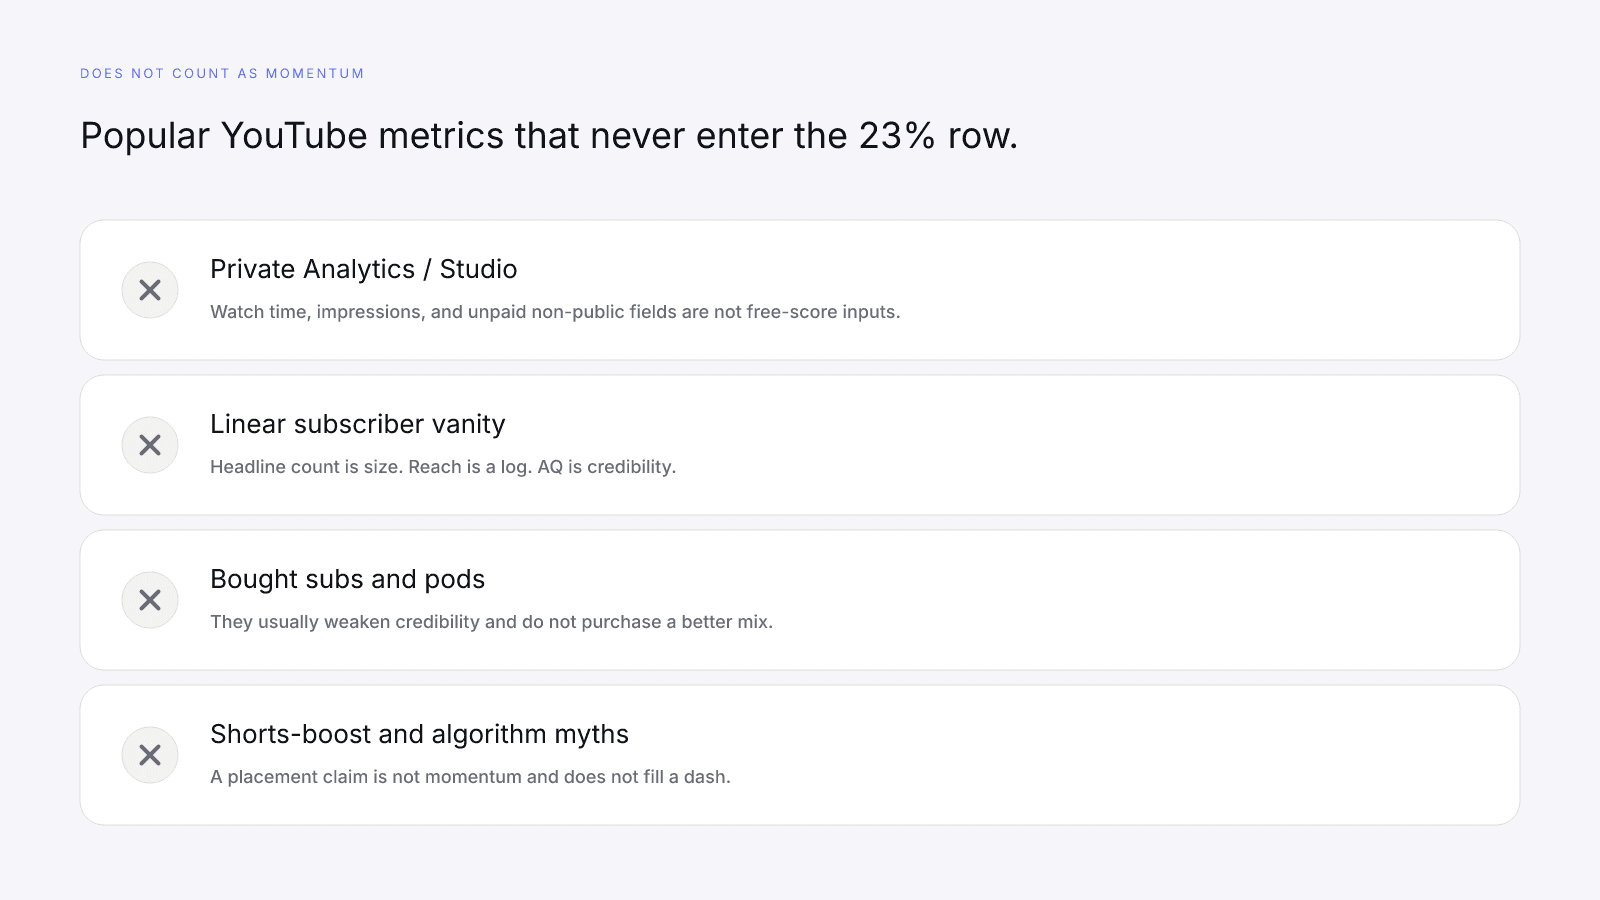
Private YouTube Analytics and Studio Insights. The free InfScore uses public creator signals. Watch-time reports, impressions, Suggested placement, and unpaid access to non-public fields are not free-score inputs. Paying $0.99 does not purchase a pipe into Studio, and it does not fill a dash with a screenshot you pasted.
Subscriber vanity as a linear grade. Headline count is size. Reach scores that size on a log scale as 23% of the model. Audience quality scores credibility as 32%. A bigger number on the channel does not, by itself, mean momentum won.
Bought subscribers, pods, and traffic that never comes back. Those usually work against you. Hollow followings tend to weaken credibility. Pods can inflate a raw ratio for a moment and still leave a weaker AQ row. InfScore will not publish a recovery score for people who did those things, and it will not treat a purchased spike as momentum you can keep.
Algorithm myths and Shorts-boost promises. InfScore is an assessment of public signals, not a growth-hack tool. There is no published "raise InfScore by posting Y Shorts" table, and this article will not invent one. A claim about Suggested or Shorts distribution does not rewrite the 23% row.
One green row. A strong YouTube reach factor is 23% of the model when the audience total exists. Cropping the card to that line is not a reading.
A homepage tile. Example cards on the homepage are illustrative. A live /score/ URL is the product.
Paying. The one-time $0.99 report unlocks denser provider modules when they exist. It leaves the 32/27/23/18 weights alone, leaves the 0–8% engagement scale alone, and does not convert a dash into a 0, a 50, or a 100.
How to check a live YouTube InfScore
Read the YouTube card the same way you read any other public InfScore: coverage first, then dashes, then the four rows, then the 0–100 number and the model id. When the job is momentum, name whether growth actually ran before you treat the subscriber screenshot as the grade.
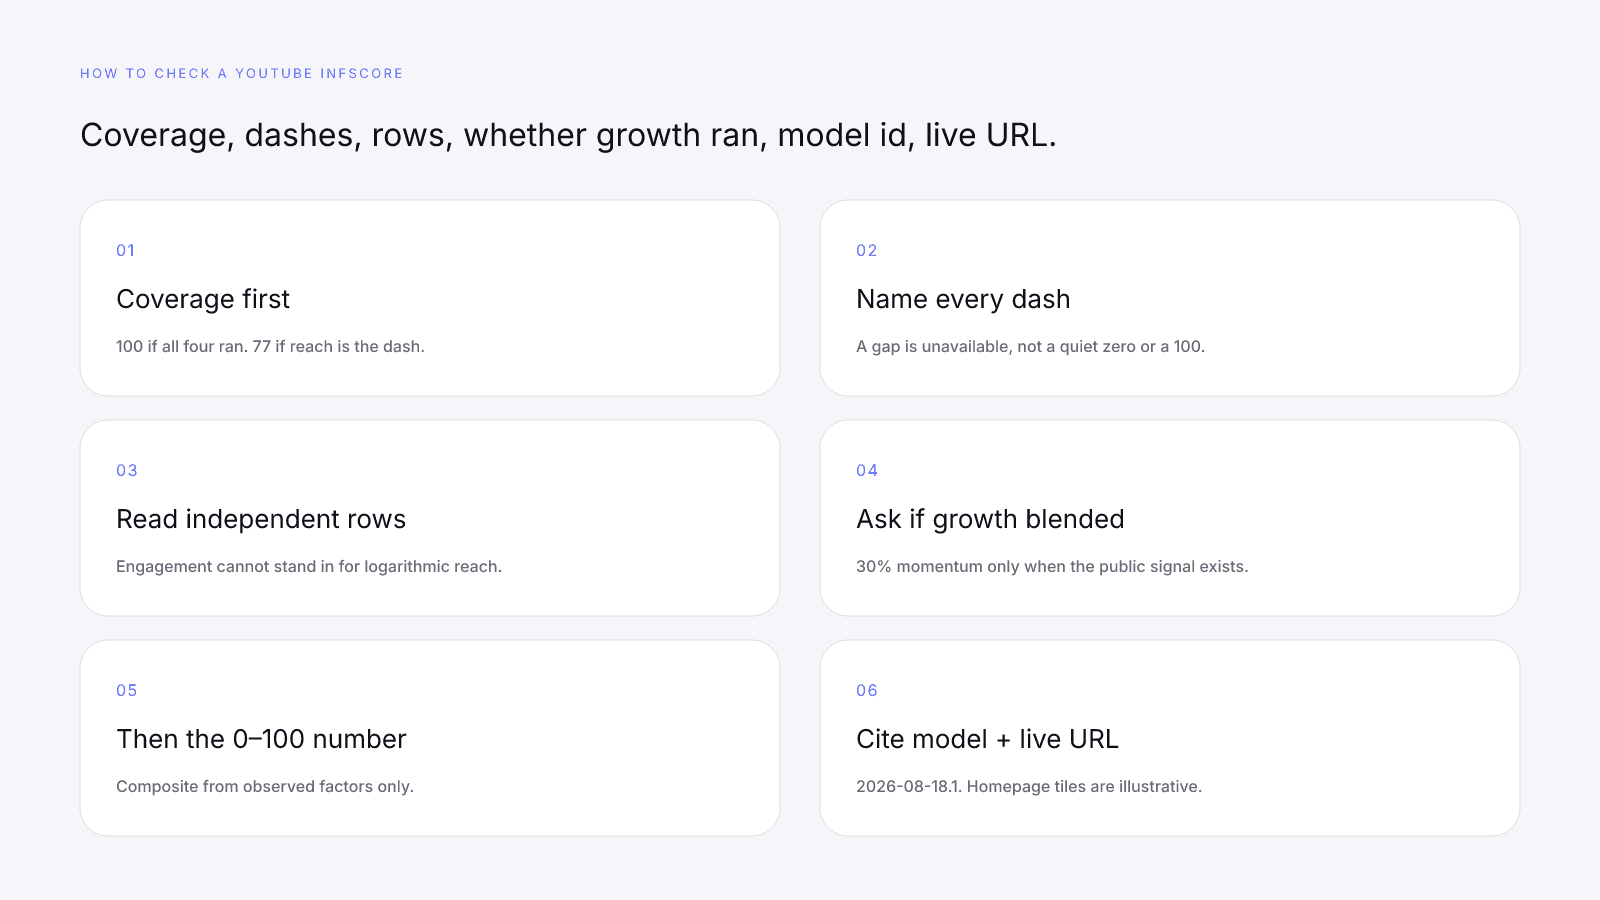
- Scoring coverage. If every factor is present, coverage is 100 and the 32/27/23/18 mix applies in full. If AQ is dashed, coverage is 68. Engagement dashed, 73. Reach & momentum dashed, 77. Platform strength dashed, 82.
- Dashes. A dash is a gap in public provider data. Treating it as zero punishes a blind spot. Treating it as 100 invents a perfect row. Missing Data on Creator Metrics is the rebalance rule.
- Independence. Each factor uses its own YouTube-facing inputs. Engagement cannot stand in for logarithmic reach. Logarithmic reach cannot stand in for a missing growth series or for AQ.
- The reach & momentum row, only if it exists. Ask whether growth blended in at 30%, or whether you are reading reach-only. Subscriber count is still just the size label.
- The 0–100 composite, after the rows. Cite model
2026-08-18.1. A 72 on this version is this mix. A 72 on a later version might mean something else. - A live URL. Open MrBeast on YouTube if you need a worked public card. Do not paste a homepage tile.
Platform strength still sits at 18% when at least one public audience was observed. On the current model the coverage floors are 45 for one observed platform, 70 for two, and 90 for three or more, plus a small balance bonus when follower counts are not concentrated on a single network. A YouTube-only lookup can still return a number near that 45 floor. It does not pick YouTube as a "best" app, and it is not a request to spam two empty handles so the floor can move.
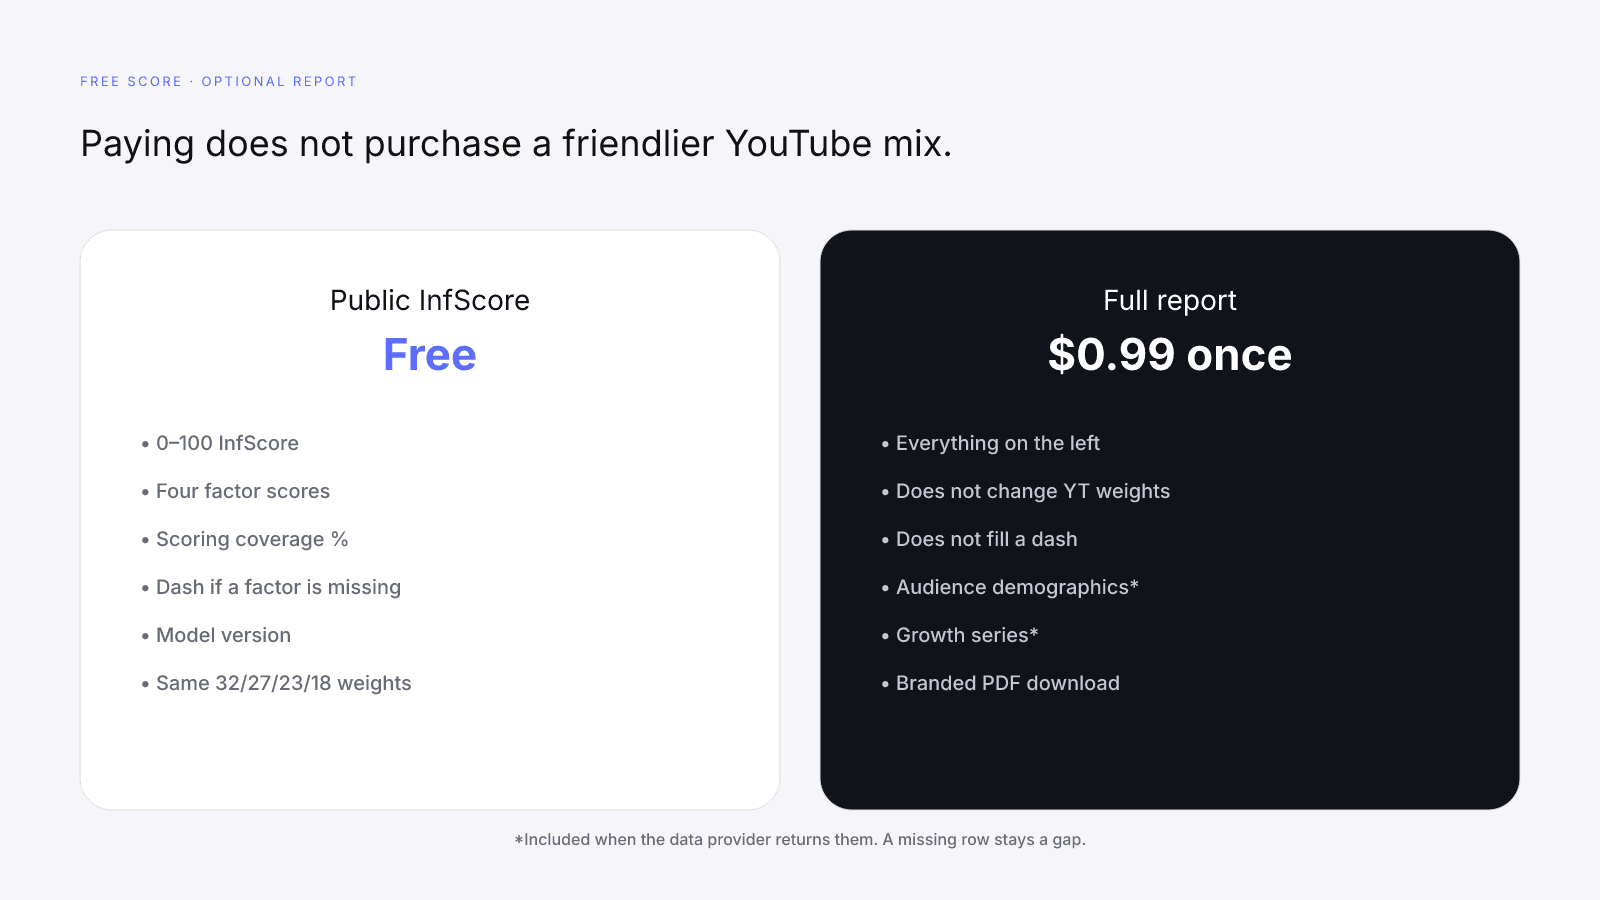
The public InfScore stays free. No signup. Pricing is one report, one dollar, no recurring fee. Use the paid report when you need to explain the score to someone else. Use the free score when you need the comparable number quickly. Both views are honest about gaps. The paid view is simply denser.
This versioned composite uses only available public creator signals. Missing factors stay unavailable and their weight is rebalanced across observed factors. It is not a percentile, price estimate, or guarantee of campaign results.
The YouTube InfScore worth trusting is the one you can check: four published factors, public inputs, visible dashes, and a momentum row you can actually read. Search a public profile on infscore.com. If you want the modules behind a specific scorecard, the full report is there for $0.99, and only when you actually need it.
FAQ
What YouTube momentum signals does InfScore use?
Reach and momentum is 23% of InfScore when a public audience total exists. The row scores that total on a log scale and blends public growth or consistency when the provider returns it. Subscriber count alone is the size label, not momentum won. Private YouTube Analytics, Suggested, and Shorts-boost myths are not free-score inputs.
Is InfScore's YouTube formula different from Instagram/TikTok?
No. YouTube is a lookup surface of the same versioned 0–100 composite, not a fork. Searching a YouTube handle still runs audience quality 32%, engagement 27%, reach and momentum 23%, and platform strength 18% on model 2026-08-18.1. Private YouTube Analytics, Suggested, and Shorts-boost myths do not move the free score.
Does a huge subscriber count mean strong momentum?
No. Subscriber count is a size label. Reach and momentum scores that public total on a log scale as 23% of the model. Growth and consistency only join the row when the provider returns them. A large YouTube following can still have ordinary momentum, a weaker engagement row, or a dashed audience-quality row. Huge subs alone do not mean momentum won. Audience quality is still 32% and engagement is still 27%.
What if growth/consistency data is missing?
Missing growth thins the momentum half of the row. Logarithmic reach still scores from the public audience total. The factor dashes only when that total is missing or not usable. A dash is a gap, not a zero. Coverage then falls by 23, to 77, because 32 + 27 + 18 = 77.
Do private YouTube Analytics improve the free InfScore?
No. The free score uses public creator signals a provider actually returned. Private YouTube Analytics, Studio Insights, watch-time screenshots, and unpaid access to non-public fields are not free-score inputs. A Studio screenshot does not fill a dash.
How does reach & momentum interact with engagement on YouTube?
They are independent rows. Engagement is 27% of the mix when a public rate exists and maps that rate onto a fixed 0–8% scale. Reach and momentum is 23%. A busy comment ratio cannot stand in for log reach, and a huge subscriber total cannot invent an engagement rate.
Does paying $0.99 change momentum weights?
No. The free InfScore is the same 0–100 composite, four factors, and coverage percentage. No signup is required. The one-time $0.99 report unlocks denser provider modules when they exist. Paying does not change weights or fill a dash.