Missing Data on Creator Metrics: Why Dashes Beat Fake Zeros
A missing creator metric is a gap, not a zero. Learn why fake zeros punish providers’ blind spots, how InfScore rebalances observed weights, and how to read scoring coverage honestly.
This versioned composite uses only available public signals. Missing factors stay unavailable and their weight is rebalanced across observed factors. It is not a percentile, price estimate, or guarantee of campaign results. Model 2026-08-18.1.
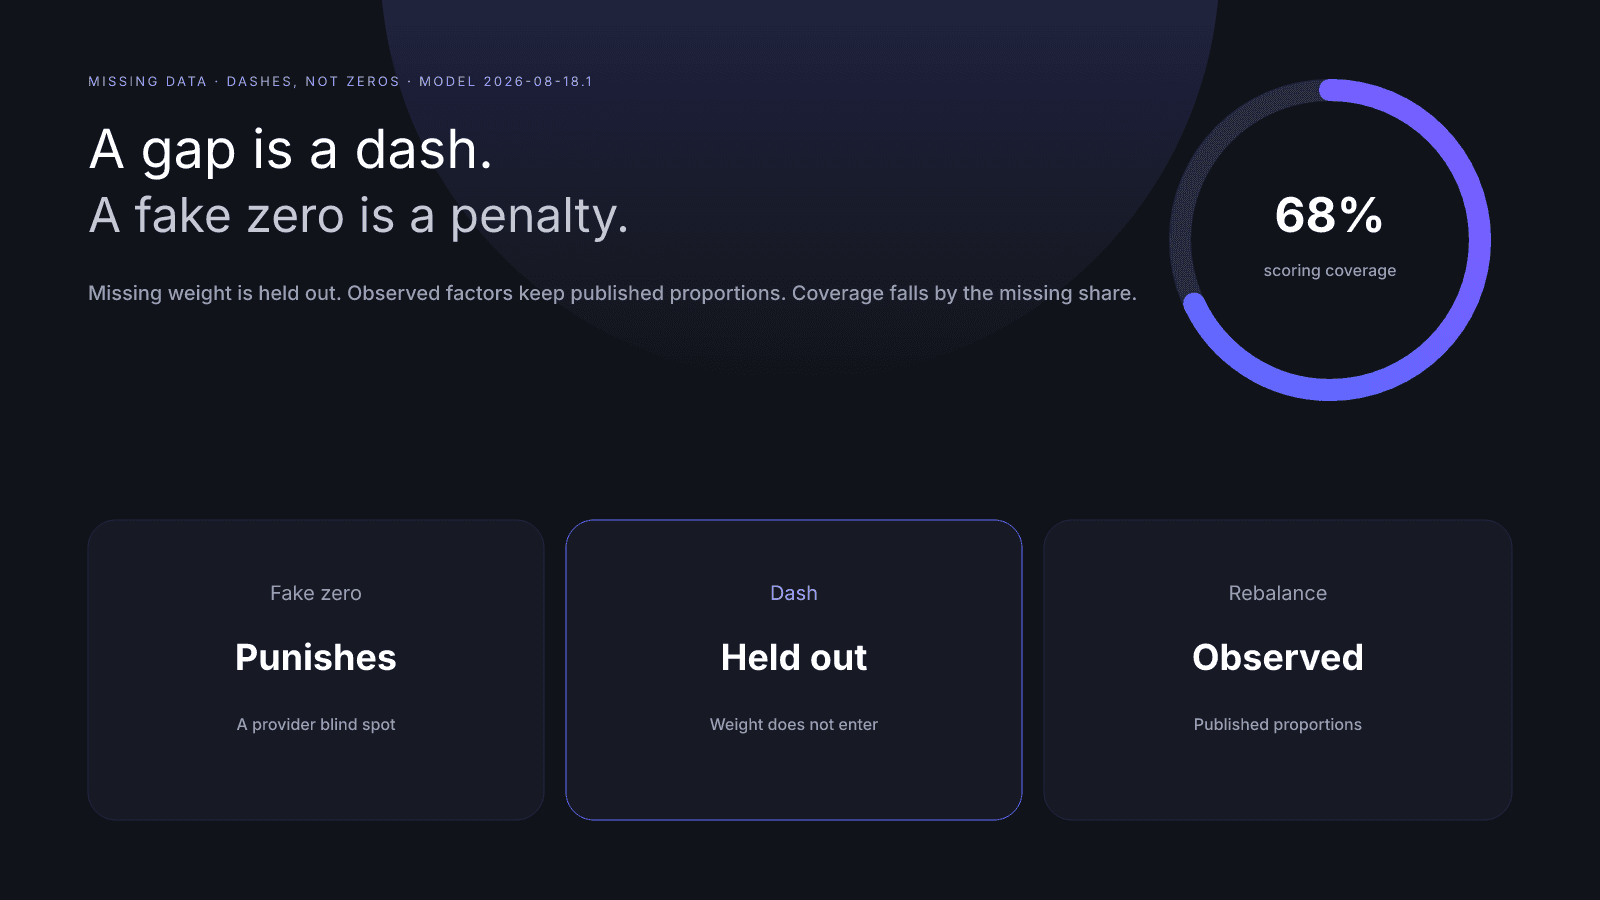
A missing creator metric is a gap, not a zero. InfScore shows that gap as a dash: the factor score is null. The missing weight is held out of the 0–100 composite. Scoring coverage falls by that published share (audience quality 32%, engagement 27%, reach & momentum 23%, platform strength 18%), and the remaining observed weights are renormalized in those same proportions.
Treating a provider blind spot as a fake zero punishes the creator for data nobody returned. Inventing a fill hides the gap. Both break influence scores. This guide is the rebalance rule on model 2026-08-18.1, with checkable coverage math. For the four-factor tour, start with How to Measure Influencer Performance.
What missing data on creator metrics actually means
Search a public Instagram, TikTok, or YouTube profile on infscore.com and you get a free scorecard. No account is required. Each of the four rows is either a 0–100 factor or a dash. Unavailable is a state the product keeps, not a hole it papers over.
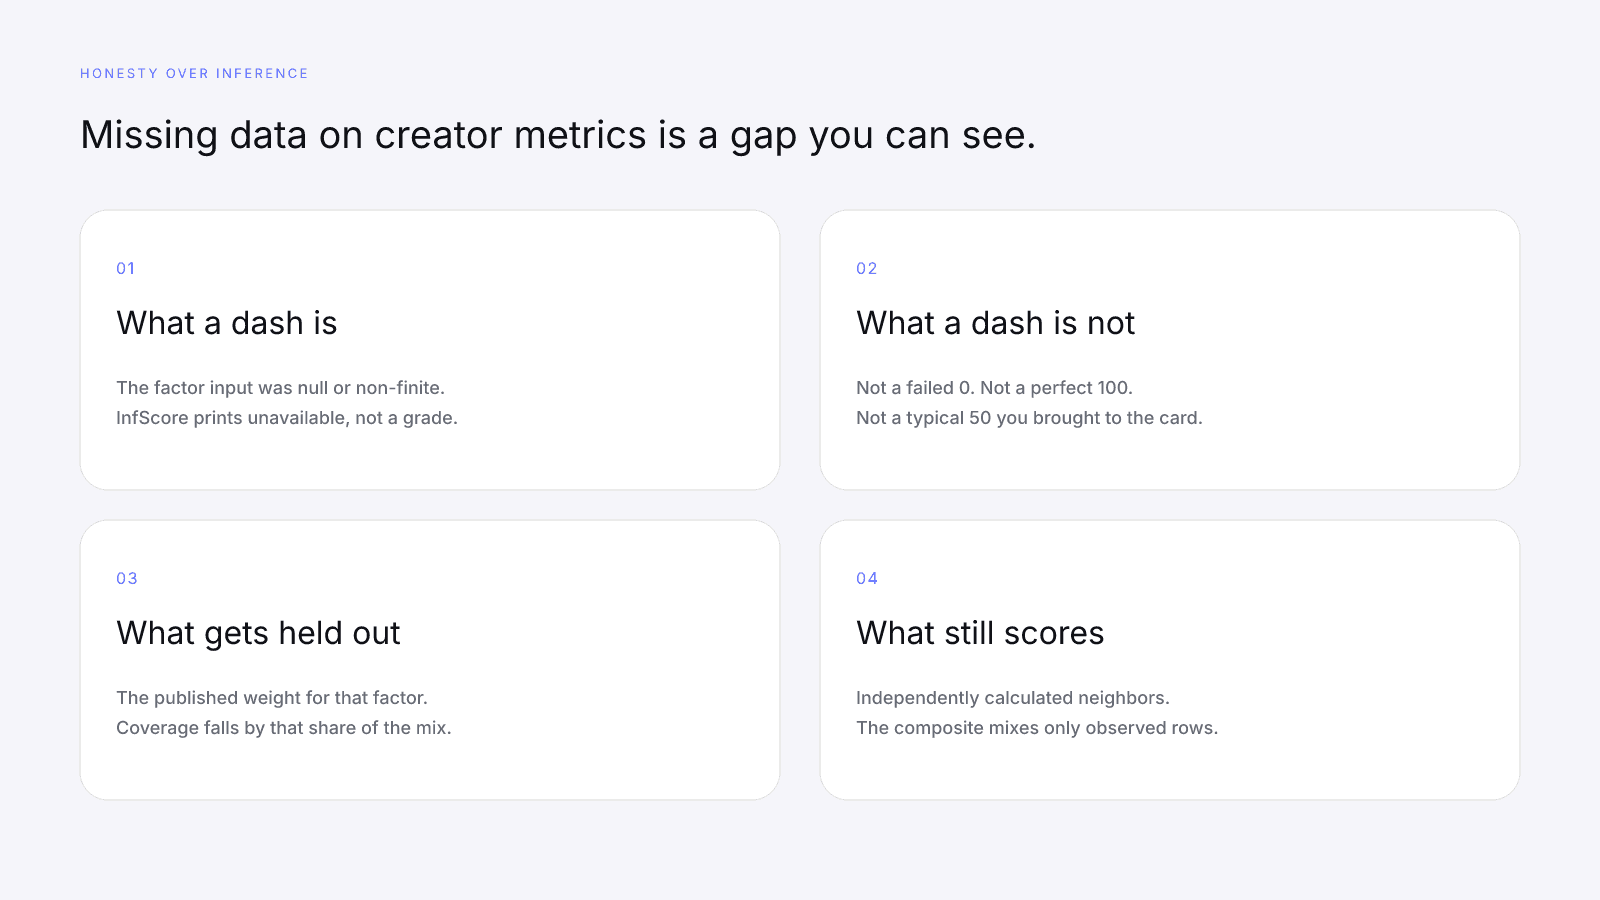
A dash means InfScore did not receive the public-provider input that factor needs. Audience quality needs a credibility signal. Engagement needs a public rate. Reach & momentum needs a usable public follower total. Platform strength needs at least one observed public audience. If that input is null or non-finite, the factor score is null. The scorecard prints a dash.
That is narrower than "we do not like this creator," and it is more useful than a silent 0. Providers do not return every field for every public profile. Some graphs have strong engagement and reach with no credibility field. Some have a complete audience module and no usable growth series. InfScore's job is to keep those states visible.
A missing sub-signal is not always a dashed factor. Reach & momentum still scores from logarithmic reach when growth is missing. Growth is the optional 30% blend, not a veto on the row. The factor dashes only when total public followers are missing or not usable. Read the row, not a rumor about which nested field failed.
Independently calculated still applies. A strong engagement row cannot lend points to a missing audience-quality row. Each factor uses its own inputs. The composite only mixes the rows that exist. See How to Read an Influencer Scorecard for the full card, and Audience Quality vs Follower Count when the dashed row is credibility.
The displayed weights on the scorecard are the weights the current model uses. The copy on every public score page is the same: missing factors stay unavailable, and their weight is rebalanced across observed factors. The gap is never inferred from the final number.
Open a live score and read the dashes rather than quoting a homepage tile. The MrBeast YouTube score is a public scorecard. Example cards on the homepage are illustrative; a score URL is the product. You can also open Emma Chamberlain on Instagram the same way.
Why fake zeros are worse than a dash
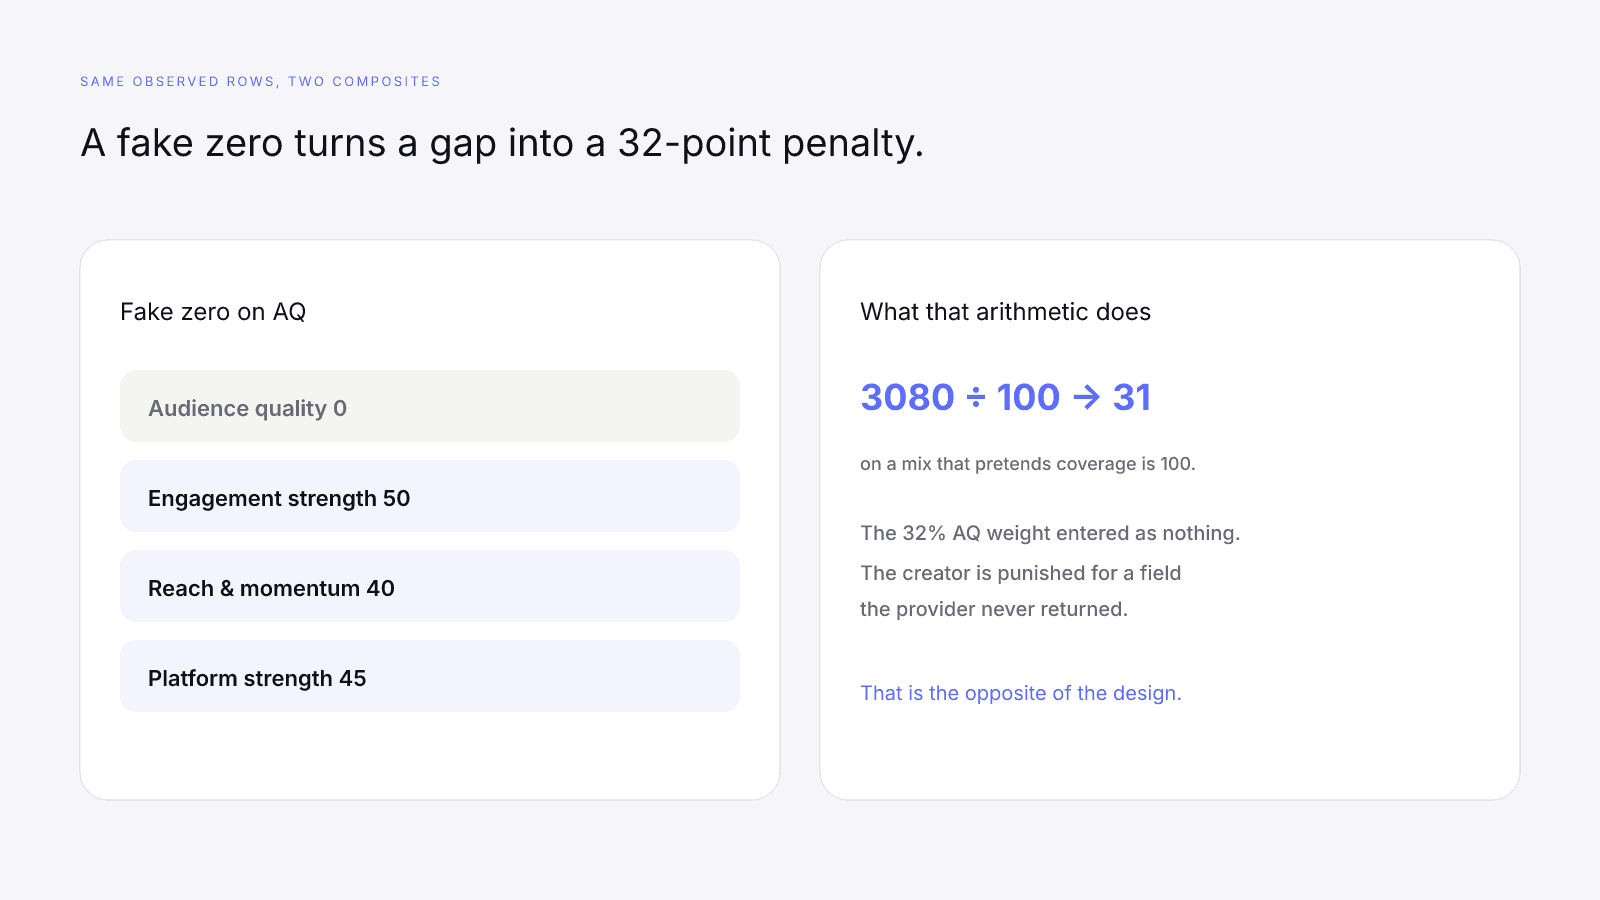
A fake zero looks like measurement. It is not. It converts "the provider did not return this field" into "this creator scored nothing on the heaviest part of the model." Audience quality is 32% of InfScore. Scoring a missing credibility signal as 0 is a 32-point penalty for a blind spot. That is the opposite of the design.
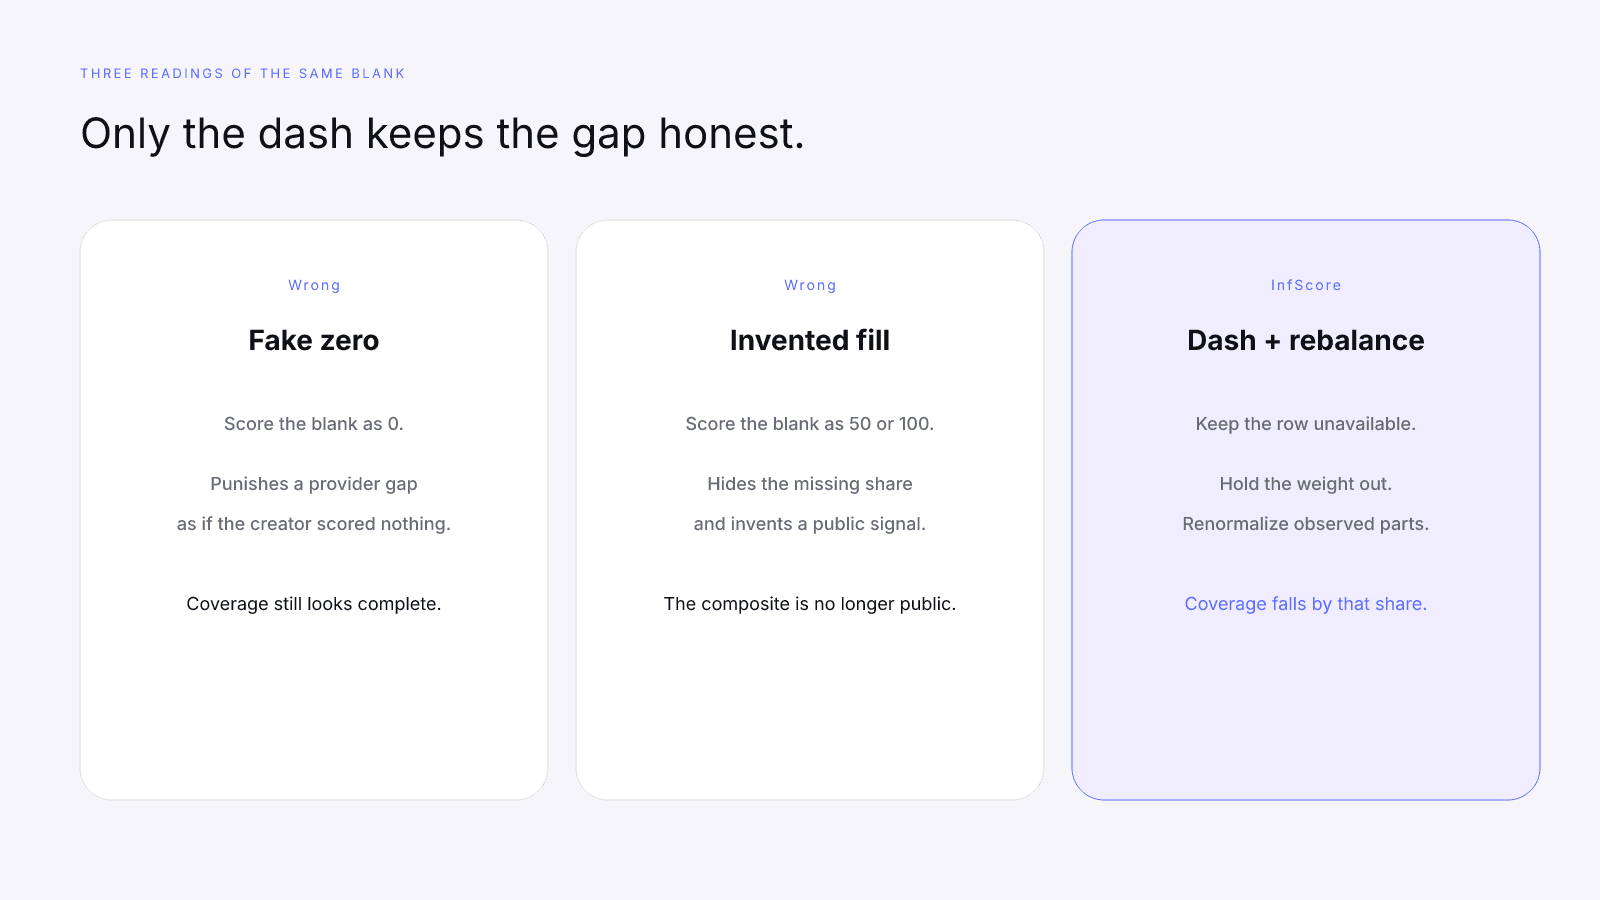
The other bad fill is optimism. Treating a dash as 100 invents a perfect row. Averaging a "typical" 50 into the blank invents a middling row. Either way you are no longer scoring public creator signals. You are scoring a story you brought to the screenshot.
Why zeros feel tempting: spreadsheets hate blanks. Rankings hate blanks. A cropped scorecard hates blanks. A 0 lets you keep a four-row average and pretend the model still ran at 100% coverage. The number gets worse, coverage looks complete, and the reader never learns which signal was absent.
Why invented fills feel tempting: they keep the composite from dropping. They also hide the only fact that mattered: a third of the model, or a quarter, did not participate. A higher number with silent fills is not more precise. It is less honest.
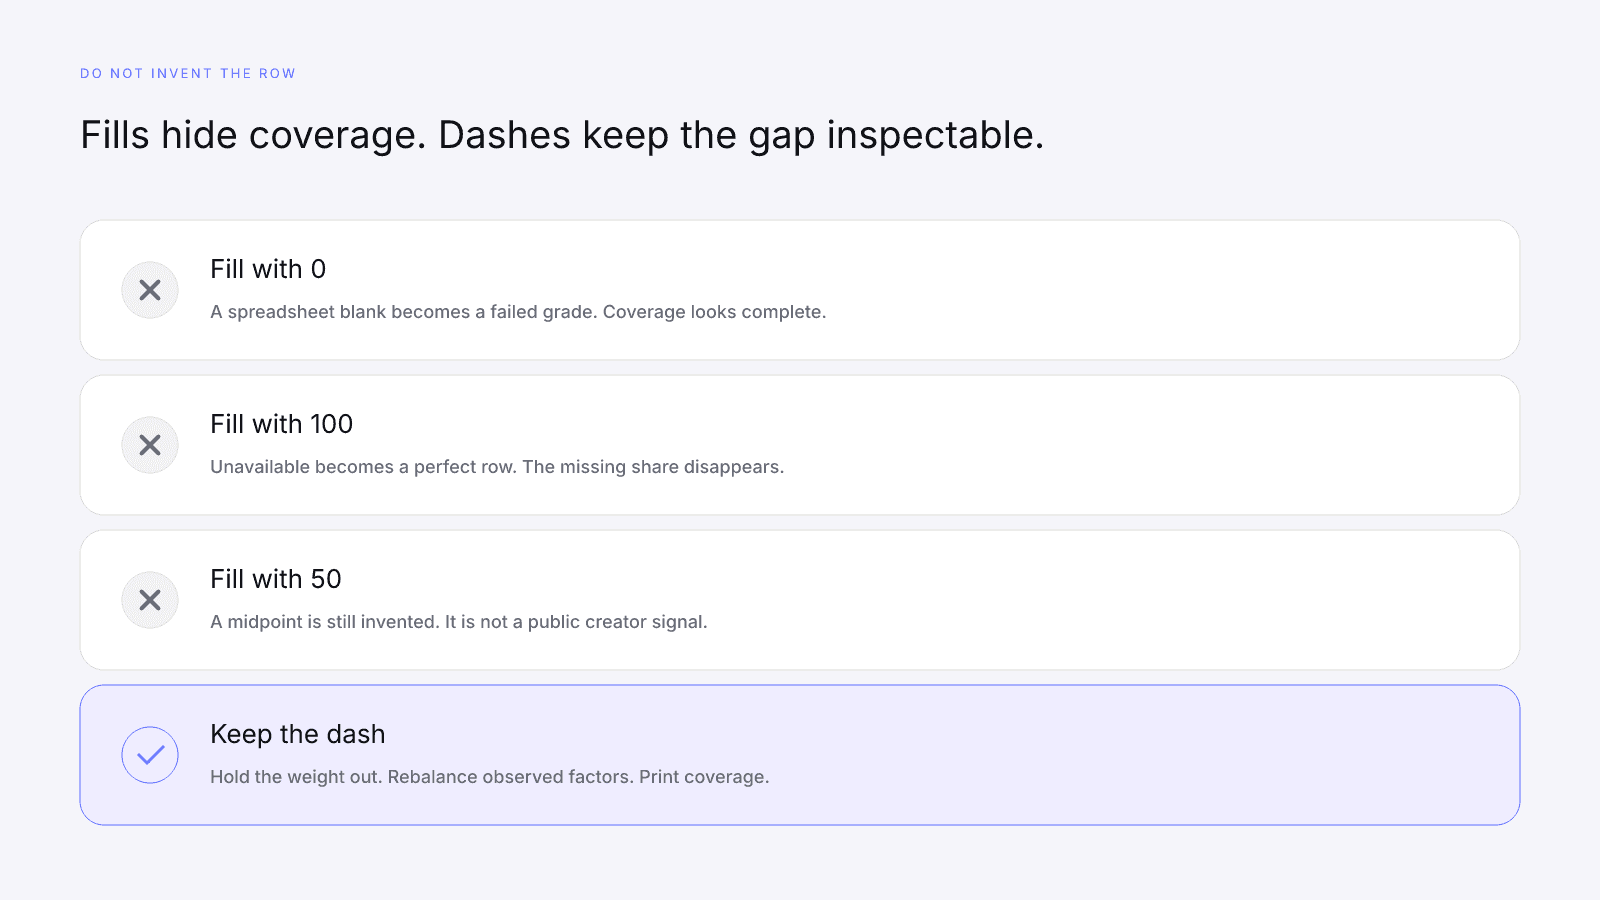
InfScore refuses both. The dash stays a dash. Coverage falls by the missing share. The remaining observed factors keep their published proportions relative to each other. That is the only reading that does not punish a provider gap or invent a row.
Do not import a rumor to fill the gap. If someone tells you "missing audience quality usually means X," ask for the sample, the date, and the field the provider actually omitted. InfScore will not invent that table for you. Engagement still has its own published conversion when the rate exists; see What a Good Engagement Rate Looks Like in 2026.
The rebalance rule, with checkable math
The composite is a weighted average of the observed factors only. Scoring coverage is the sum of the published weights that actually ran. If every factor is present, coverage is 100 and the 32/27/23/18 mix applies in full. If a factor is a dash, its weight does not enter. Coverage falls by that weight. The remaining weights are renormalized so they still sit in the published proportions.
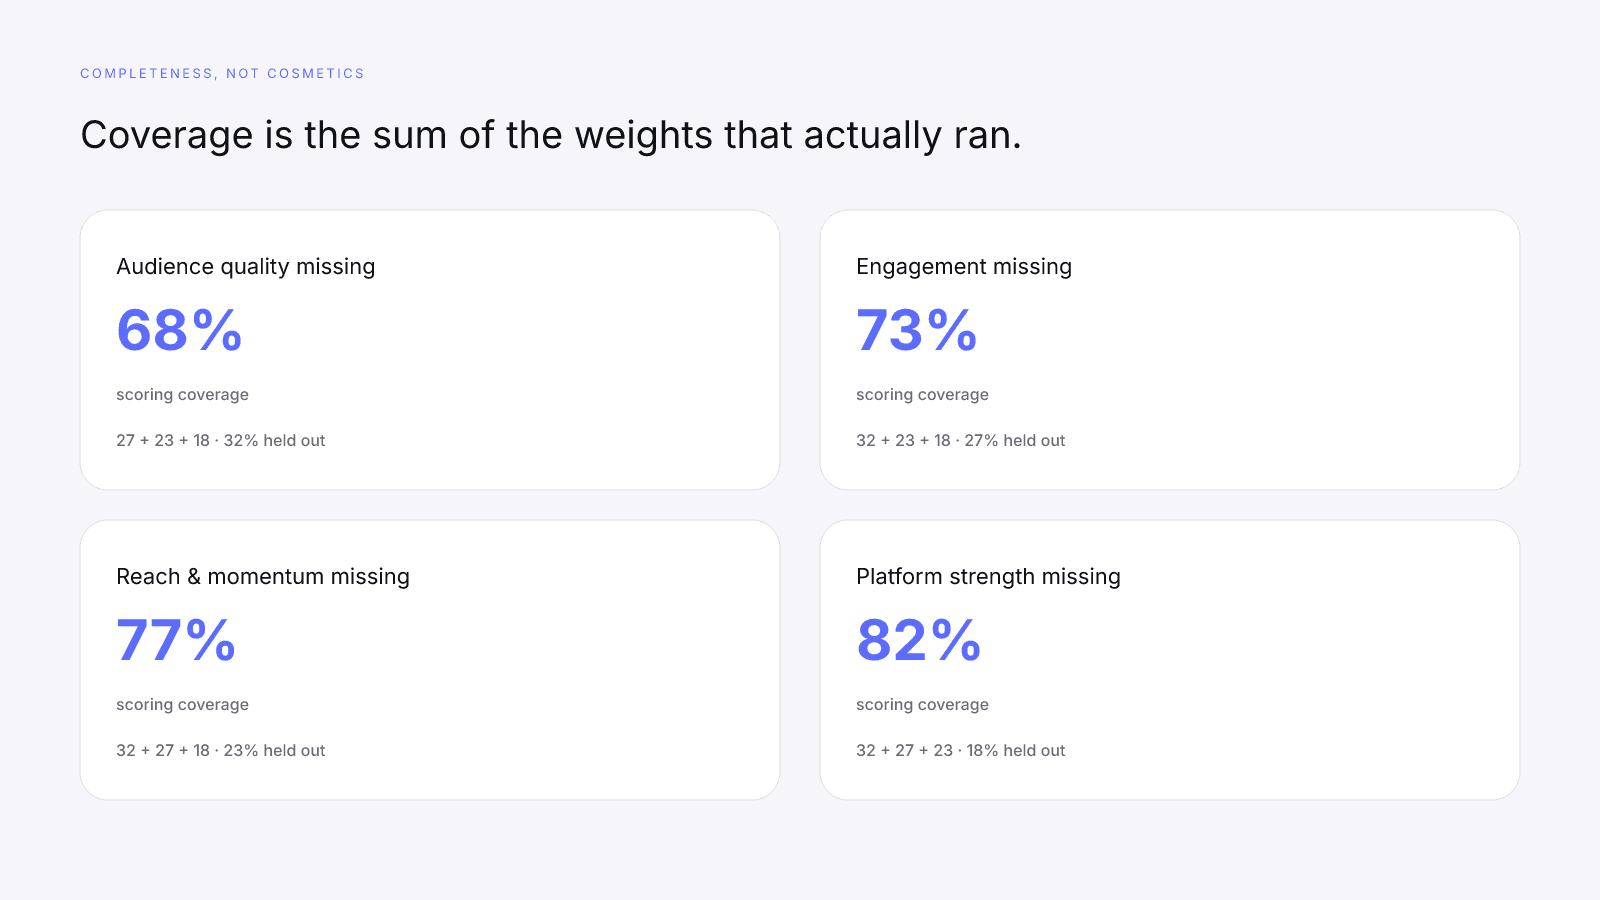
Checkable from the published mix:
- Audience quality missing → coverage 68 (27+23+18).
- Engagement missing → coverage 73 (32+23+18).
- Reach & momentum missing → coverage 77 (32+27+18).
- Platform strength missing → coverage 82 (32+27+23).
- Nothing usable present → the score is 0, with no fantasy average behind it.
Coverage is completeness, not a grade on the creator. A 68 is information: 32% of the model did not participate. It is not an accusation.
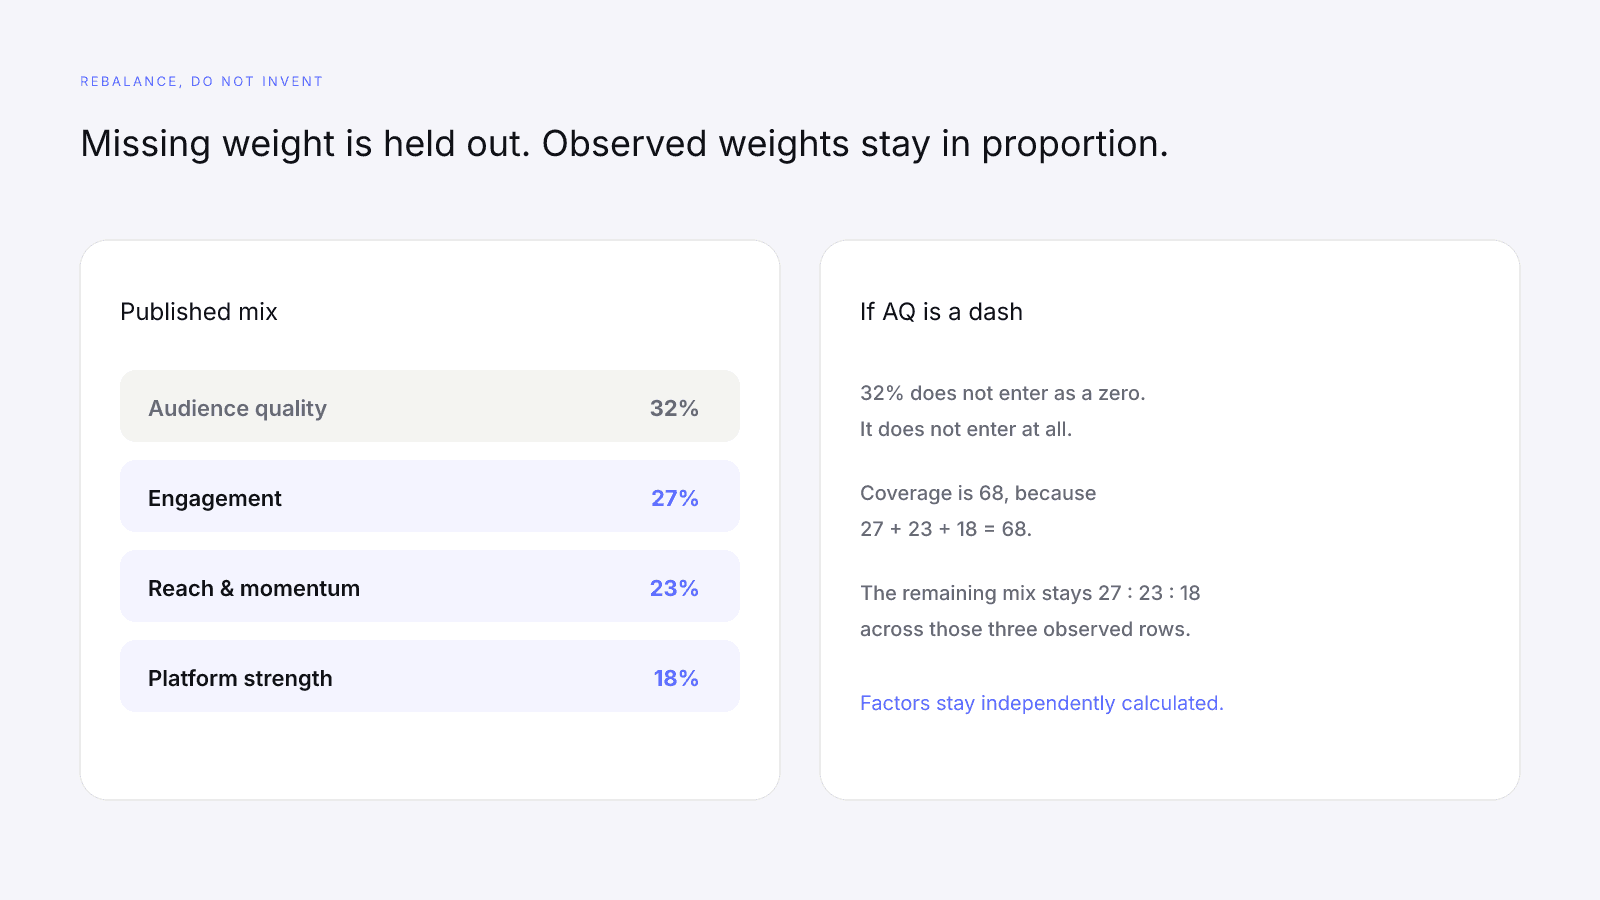
When audience quality is the dash, the 32 weight is held out. The three observed weights still stand in the ratio 27 : 23 : 18. They are not equal slices. Engagement does not become "one of three rows." It remains 27/68 of the remaining mix. Reach remains 23/68. Platform strength remains 18/68. That is what "renormalized in published proportions" means.
A checkable case from the model tests: audience quality missing, engagement at 4% public rate (50 on the factor), reach & momentum 40, platform strength 45. The 32% weight is held out. Coverage is 68 (27+23+18). The remaining mix is 27/68, 23/68, and 18/68. The composite is (50 × 27 + 40 × 23 + 45 × 18) ÷ 68, which is 3080 ÷ 68, and rounds to 45. The other three rows are still real. Paying does not fill that dash.
If those same three observed rows were mixed with a fake audience-quality zero on the full 32/27/23/18 mix, the arithmetic would be 3080 ÷ 100, which rounds to 31. Same public signals. Same three factor scores. A quieter composite, and a coverage line that would lie if you still printed 100. That is why the dash beats the fake zero.
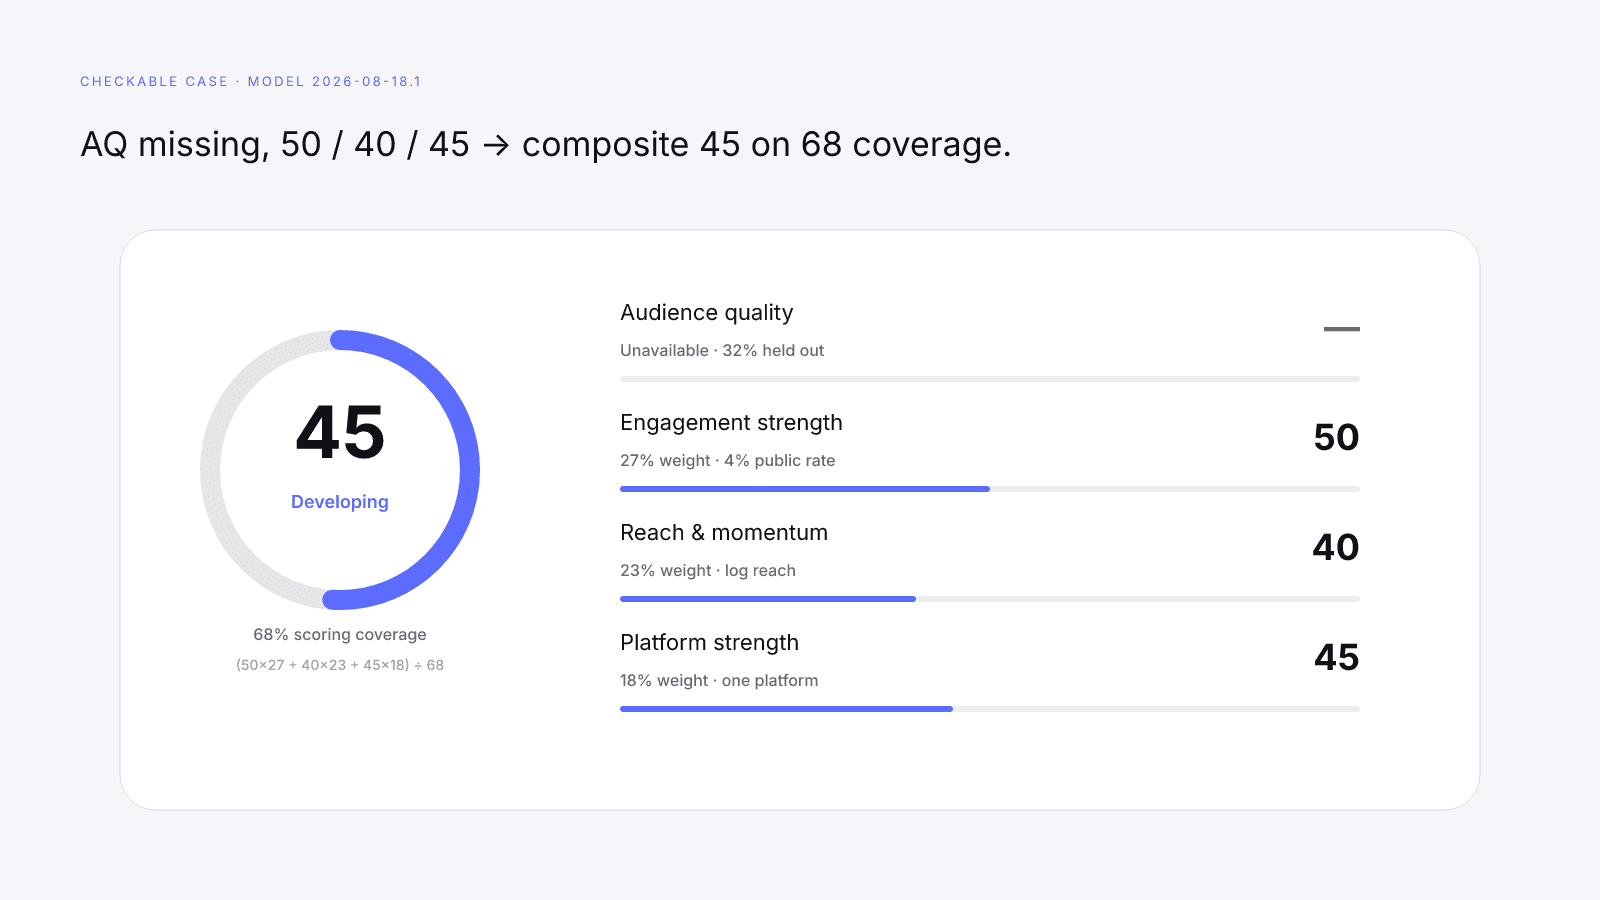
Compare two scores only when you also look at the model id. If the formula changes later, the version string on the scorecard changes with it. A 45 on 2026-08-18.1 with 68% coverage is a 45 on this mix, from these observed rows. A 45 on a later version might mean something else.
When you screenshot a score, include the dashed row, the coverage line, and the model id. A bare 45 without those three facts is an incomplete citation.
Independence when a row is dashed
Independence is the rule that keeps a dash from infecting the neighbors. Each factor is calculated from its own inputs. A missing audience-quality row does not rewrite engagement strength. A missing engagement row does not rewrite logarithmic reach. Platform strength does not donate points to fill a blank.
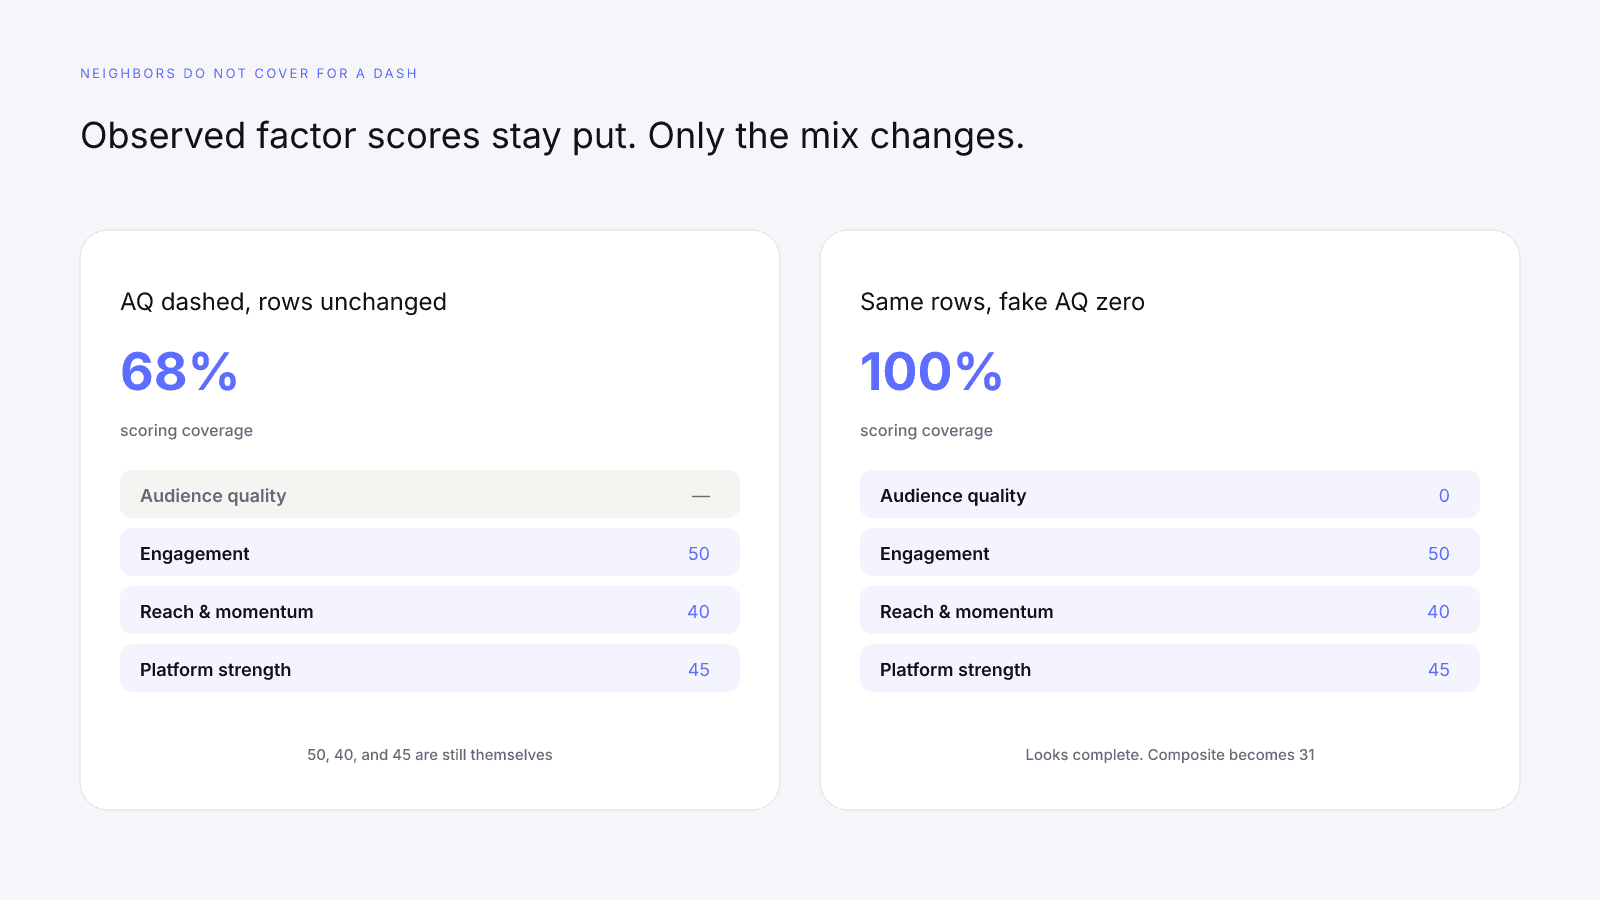
In the worked case above, engagement stays 50, reach & momentum stays 40, and platform strength stays 45 after audience quality dashes. The composite changes because the mix changed, not because InfScore edited the remaining rows. You can still read those three numbers as themselves. You cannot read them as a substitute for the missing 32%.
What independence forbids:
- Borrowing a "typical" audience-quality score from the engagement row.
- Inferring the missing factor from the final composite.
- Treating one strong line as the InfScore while a neighbor is dashed.
- Averaging the visible rows in your head as if the dash were a zero.
A high engagement factor is a 0–8% conversion on 27% of the model when that rate exists. A high reach factor is logarithmic size, plus growth when it exists. Neither row can stand in for credibility. Cropping the card to the greenest line next to a dash is not a reading. It is a crop.
Independence also cuts the other way. A dashed row is not a secret 100. Unavailable is not a perfect score. Coverage falls by the missing weight instead.
If several rows dash, the same rule repeats. Each missing weight is held out. Coverage is whatever remains. If nothing usable is present, the score is 0. There is no hidden prior, no niche average, and no "we assumed the usual mix."
How to cite a partial InfScore
A partial score is still a real score. It is not a full-model score. Citation is how you keep those two facts from collapsing into one screenshot.
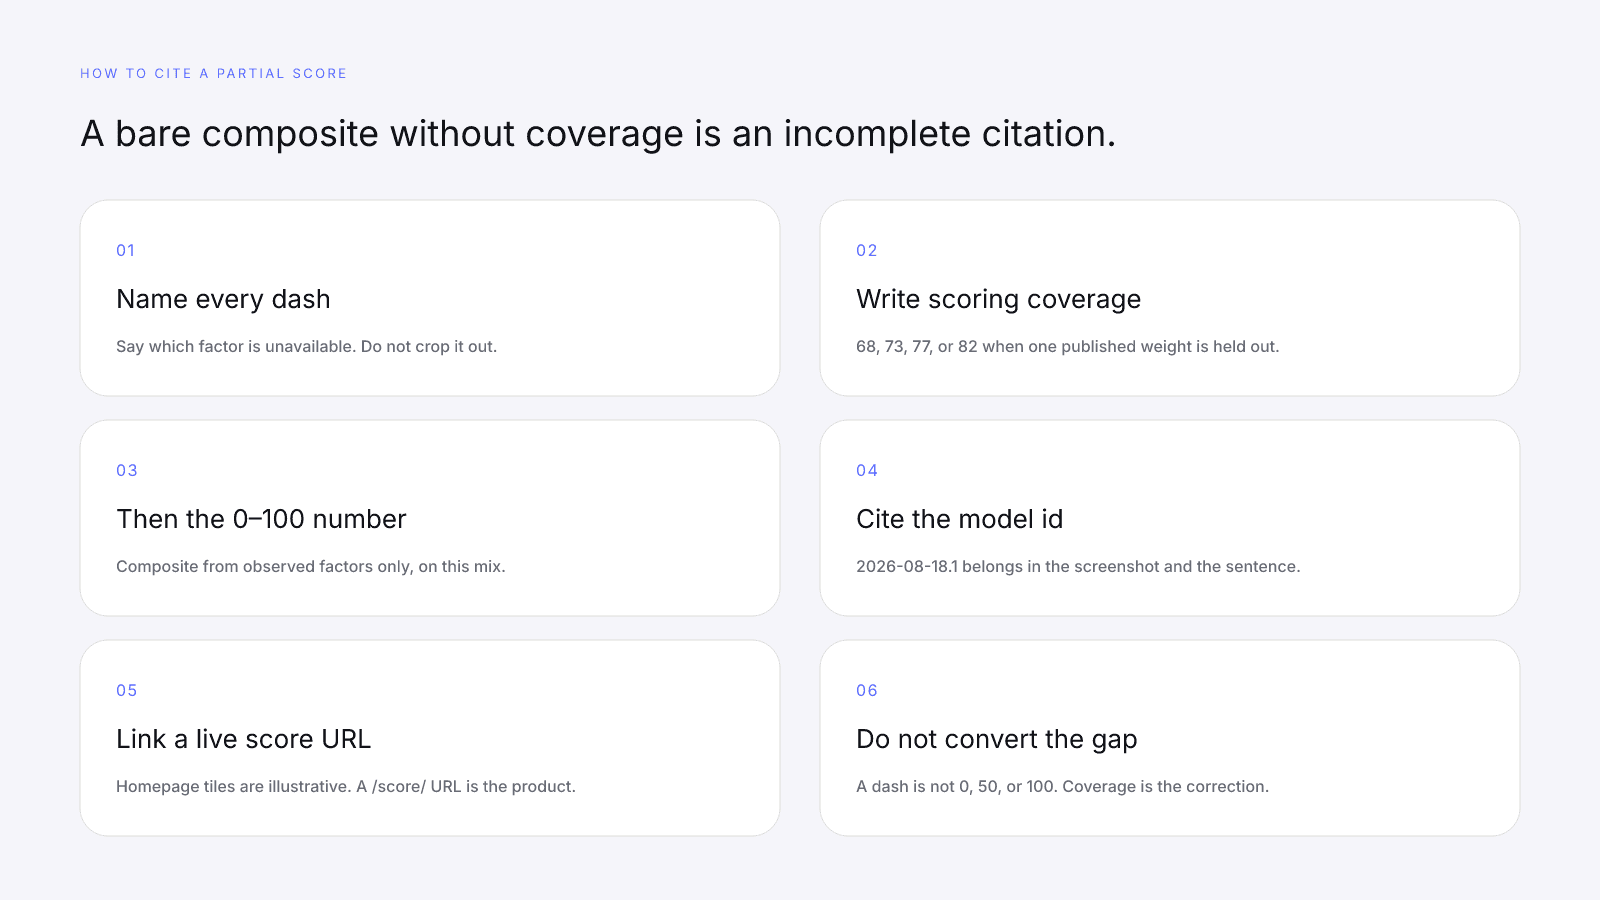
Cite it in this order:
- Name every dashed factor. "Audience quality unavailable" is a sentence. A quiet crop is not.
- Write scoring coverage. If AQ is missing, say 68% of the model ran. If engagement is missing, say 73. Reach & momentum missing, 77. Platform strength missing, 82.
- Then the 0–100 composite, and only as the mix of factors that actually returned a number.
- Cite model
2026-08-18.1. Same formula, same comparison; different version, different conversation. - Link a live
/score/URL, not a homepage tile. Open the MrBeast YouTube score or Emma Chamberlain on Instagram if you need a worked public card.
A useful citation sounds like this: composite 45 on model 2026-08-18.1, 68% scoring coverage, audience quality dashed, engagement 50, reach & momentum 40, platform strength 45. That is the worked test case. Swap in the live rows you actually opened. Do not swap in a fill.
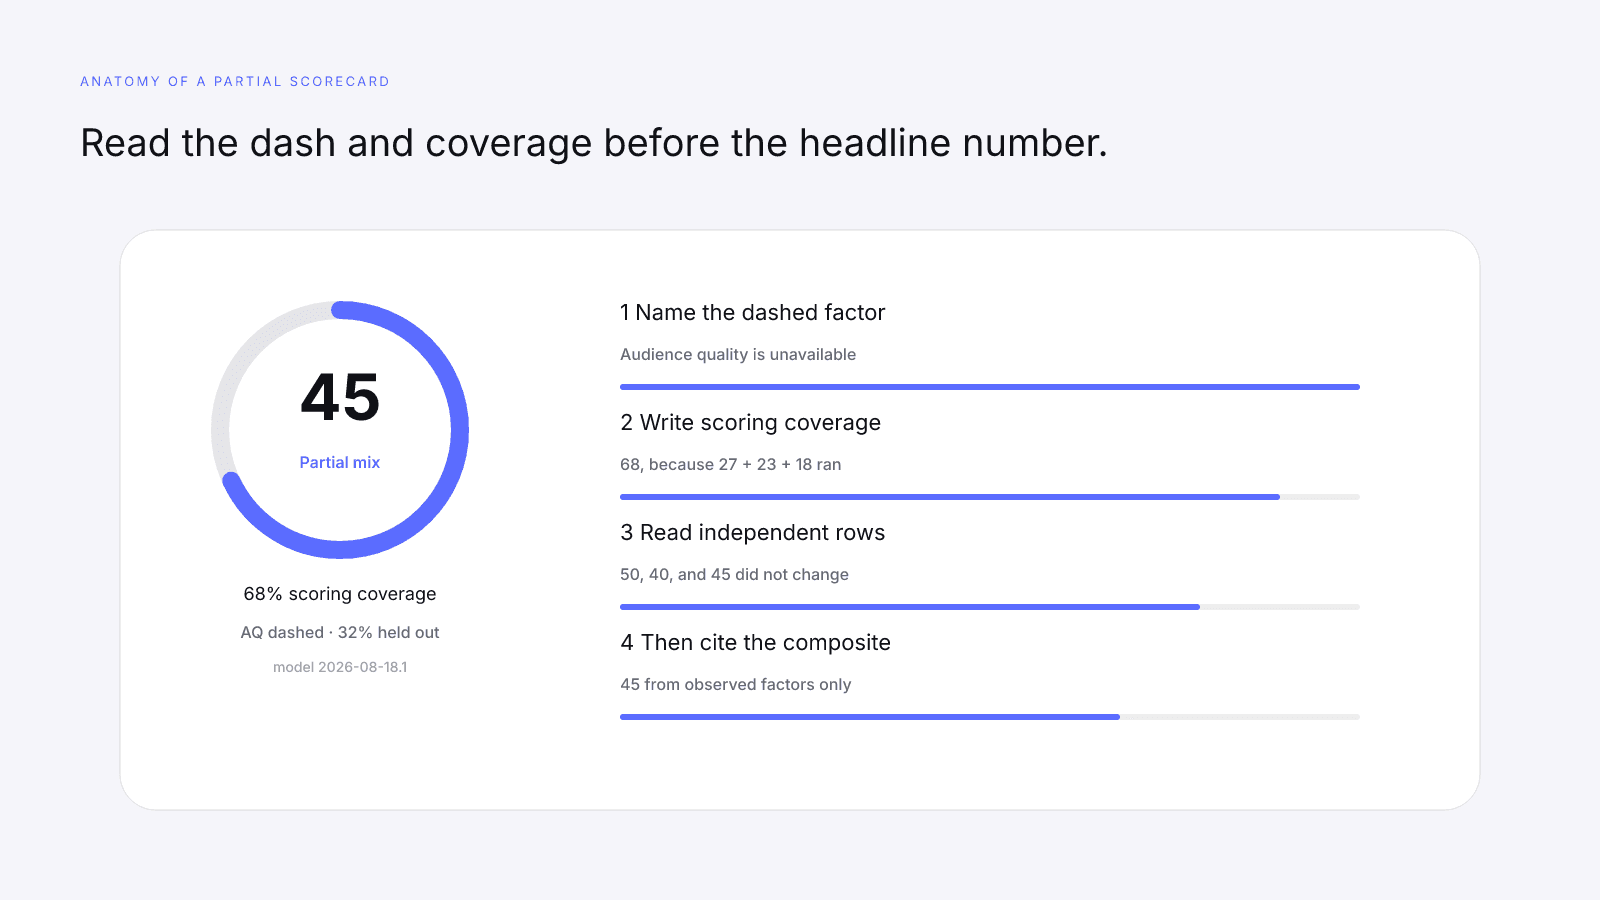
A higher InfScore with 50% coverage is not better by default than a slightly lower number with 100% coverage. Two creators with the same headline engagement can have different InfScores once coverage and the other rows are in the picture. Coverage is part of the reading, not fine print.
This versioned composite uses only available public creator signals. Missing factors stay unavailable and their weight is rebalanced across observed factors. It is not a percentile, price estimate, or guarantee of campaign results.
What $0.99 does and does not do
The public InfScore stays free. No signup. The denser report is a one-time $0.99 unlock, not a subscription. Pricing is one report, one dollar, no recurring fee.
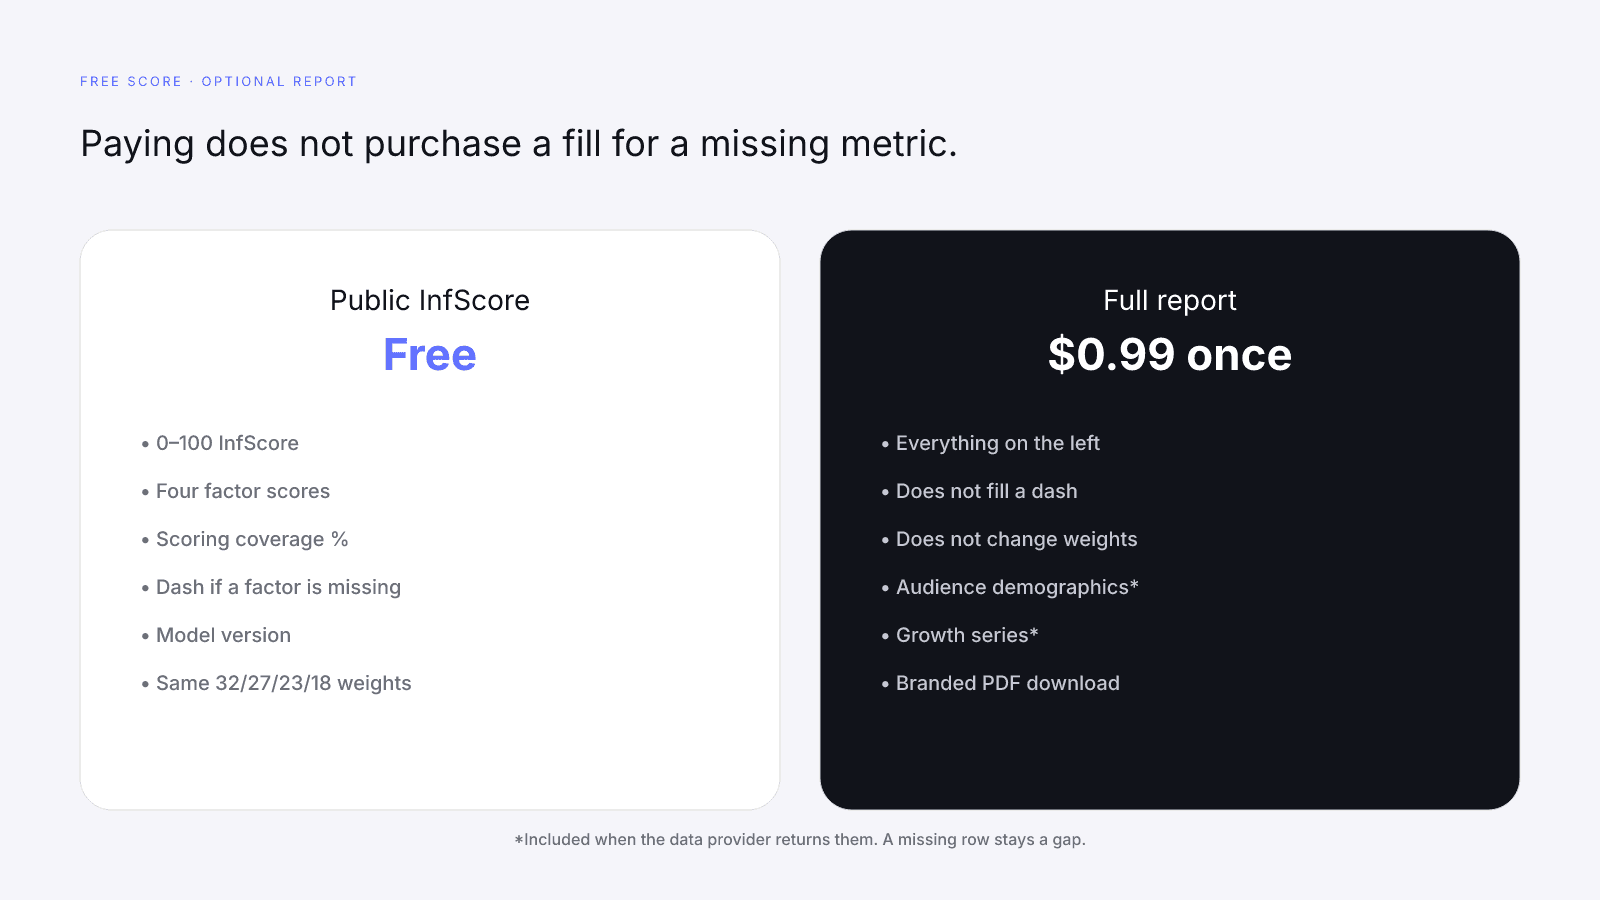
Paying does not purchase a friendlier mix, move the 32/27/23/18 weights, or convert a dash into a zero, a 50, or a 100. It adds provider modules when they exist: denser audience breakdown, growth series, platform deep dives, similar creators, and a branded PDF. Fields the provider did not send stay unavailable there too.
Use the paid report when you need to explain the score to someone else. Use the free score when you need the comparable number quickly. Both views are honest about gaps. The paid view is simply denser.
The honest version of a missing creator metric is the dash you can still see. Fake zeros and invented fills are the readings that make the number look complete while the model is not. InfScore is the part that holds the gap still long enough to compare.
FAQ
What does missing data on creator metrics mean on InfScore?
A missing creator metric is a gap in public provider data, not a failed grade. InfScore shows that factor as a dash (null), holds its published weight out of the 0–100 composite, and reports scoring coverage as the sum of the weights that actually ran.
Does InfScore treat a missing metric as a zero?
No. A dash is not a quiet zero. Treating missing public-provider signals as zeros would punish a creator for a provider blind spot. InfScore keeps the gap visible and rebalances only the observed factors.
How does InfScore rebalance when a factor is a dash?
The missing weight is held out. Remaining observed weights are renormalized in their published proportions. Audience quality is 32%, engagement 27%, reach and momentum 23%, and platform strength 18%. If audience quality is missing, coverage is 68, because 27 + 23 + 18 = 68.
What is scoring coverage if one InfScore factor is missing?
Coverage is the sum of the published weights that ran. Audience quality missing → 68 (27+23+18). Engagement missing → 73 (32+23+18). Reach and momentum missing → 77 (32+27+18). Platform strength missing → 82 (32+27+23). If nothing usable is present, the score is 0.
Are InfScore factors still independent when a row is dashed?
Yes. Each factor is calculated independently from its own inputs. A dashed row cannot borrow points from a neighbor, and a strong neighbor cannot invent the missing score. The composite only mixes the rows that returned a number.
Does the $0.99 report fill a missing dash?
No. The free InfScore is the same 0–100 composite, four factors, and coverage percentage. No signup is required. The one-time $0.99 report unlocks denser provider modules when they exist. Paying does not change weights or fill a dash.
How should I cite a partial InfScore?
Name every dashed factor, write the scoring coverage, cite model 2026-08-18.1, and link a live /score/ URL rather than a homepage tile. A bare composite without coverage is an incomplete citation.