What a Good Engagement Rate Actually Looks Like in 2026
A good engagement rate in 2026 is contextual—not a single magic %. See how InfScore maps public ER onto a fixed 0–8% scale (27% of the score) and how to read it without vanity metrics.
This versioned composite uses only available public signals. Missing factors stay unavailable and their weight is rebalanced across observed factors. It is not a percentile, price estimate, or guarantee of campaign results. Model 2026-08-18.1.
There is no universal "good" engagement rate in 2026. A 3% public rate is not weak by default, and a 6% rate is not elite by default. Those labels usually come from unpublished niche averages you cannot check.
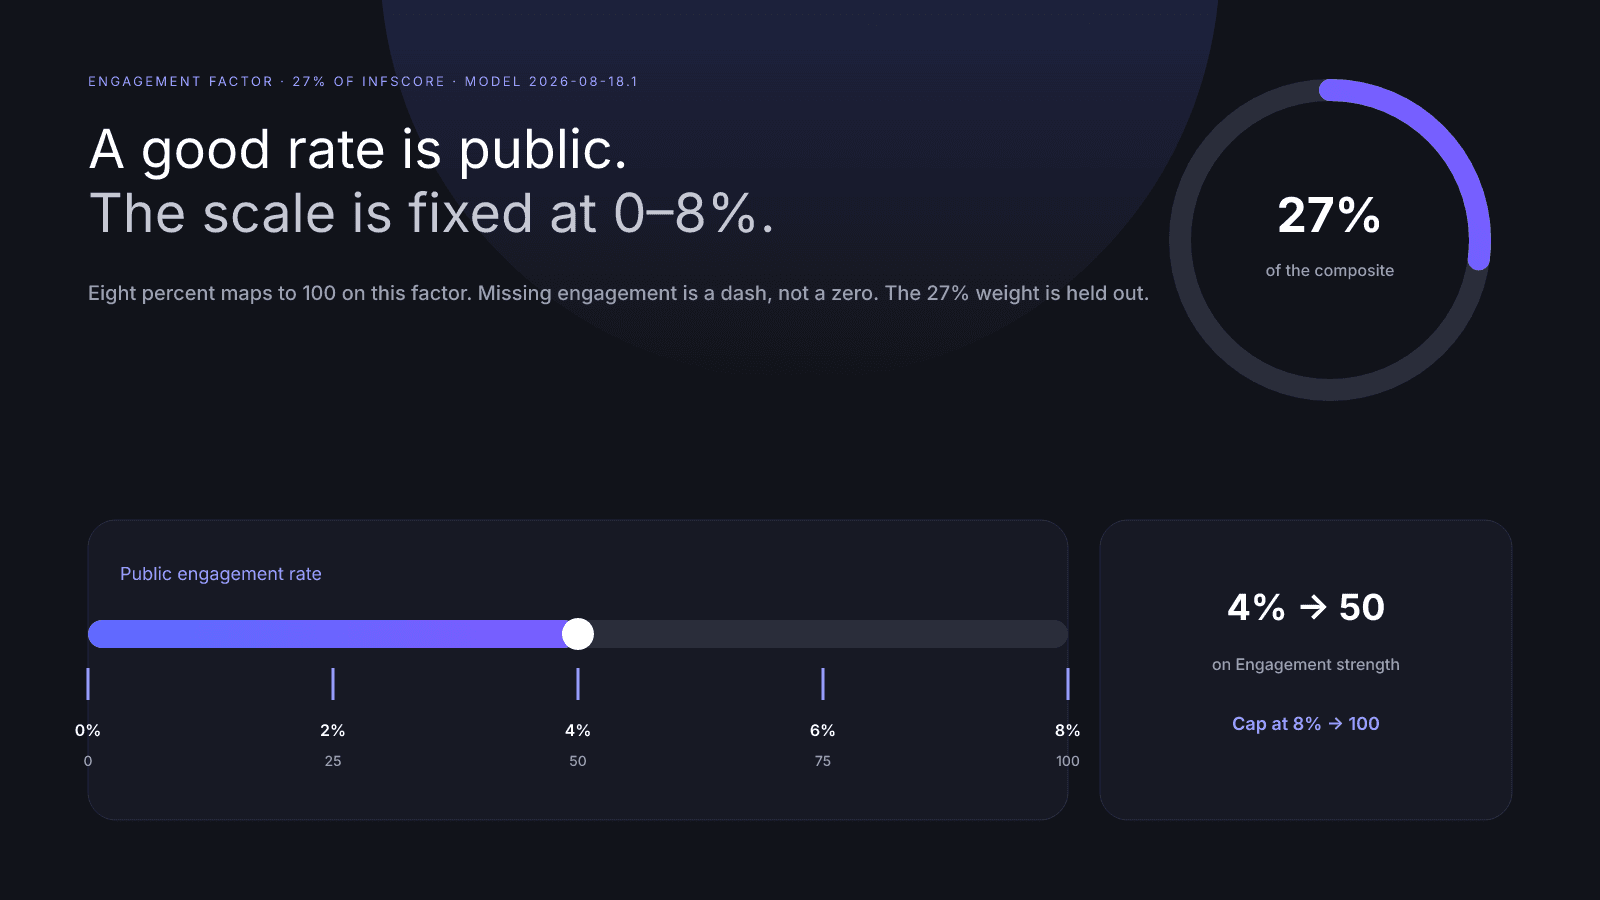
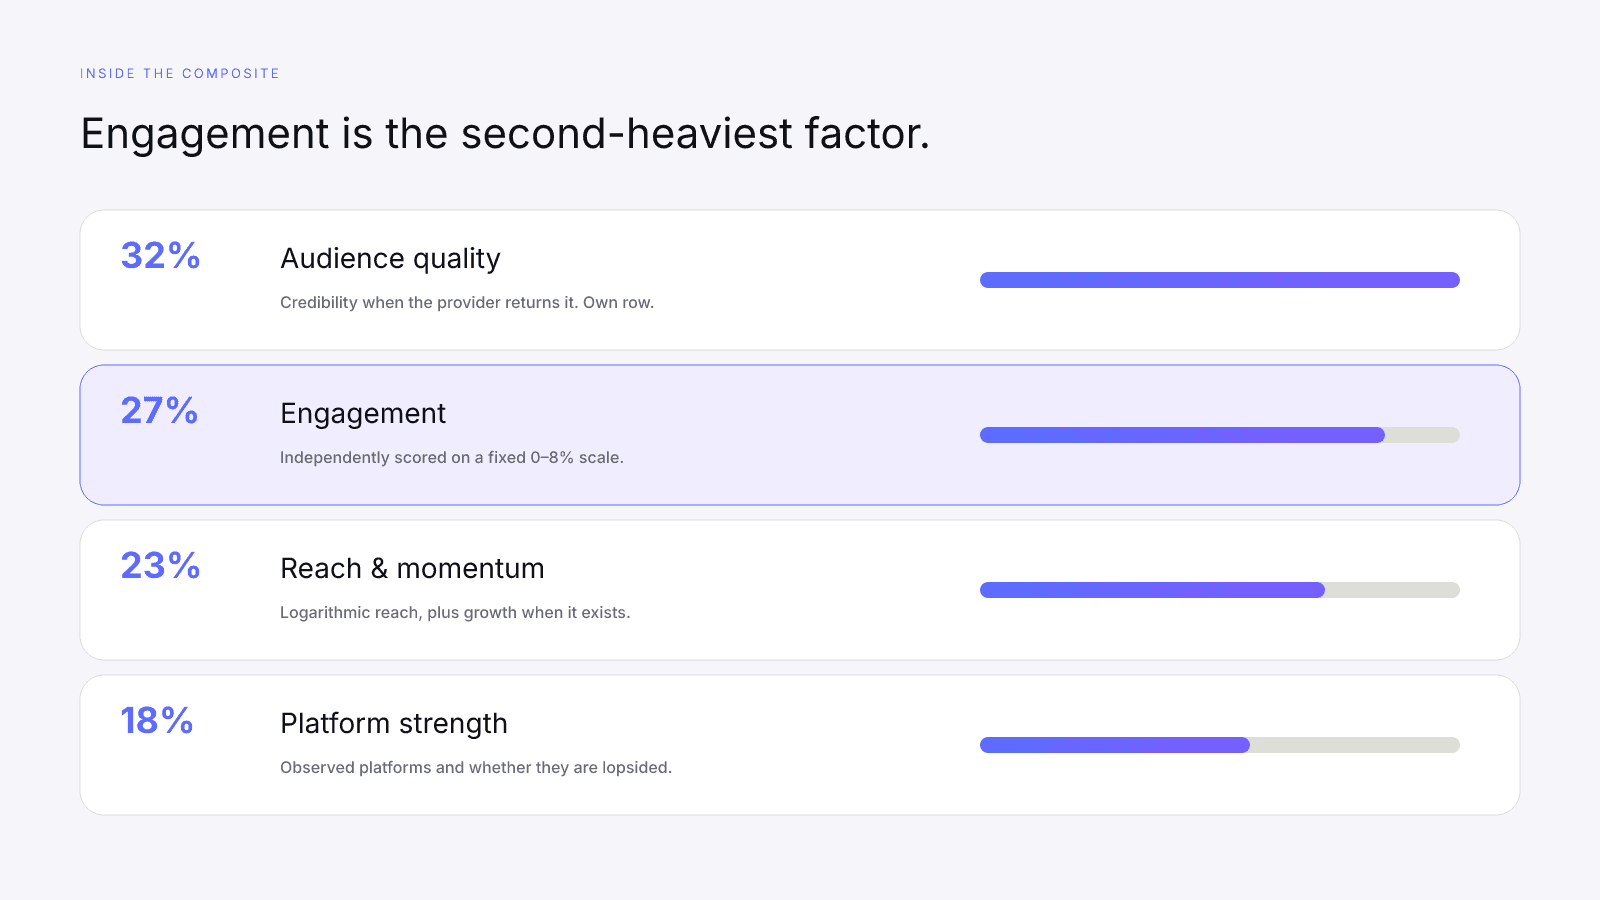
What you can check is the public engagement rate a provider actually returns, scored on a published scale. InfScore maps that public ER onto a fixed 0–8% scale. Four percent becomes 50 on the engagement factor. Eight percent becomes 100. That factor is 27% of the versioned 0–100 composite, next to audience quality 32%, reach & momentum 23%, and platform strength 18%.
If the rate is missing, the row is a dash, not a zero. The rest of this guide is how to read that conversion on model 2026-08-18.1 without treating a single percentage as the whole story. For the four-factor tour, start with How to Measure Influencer Performance.
What engagement rate means
Engagement rate is a ratio: public interactions against the audience the provider can see. InfScore does not invent that ratio. It uses the public engagement percentage the provider returns for the profile you searched.
That is narrower than "how loved the creator is," and it is more useful than follower count. A large audience can be quiet. A smaller audience can comment, save, and share. The rate is the public signal. It does not set a price, rank a percentile, or promise that a brand deal will work.
A useful engagement reading has four parts:
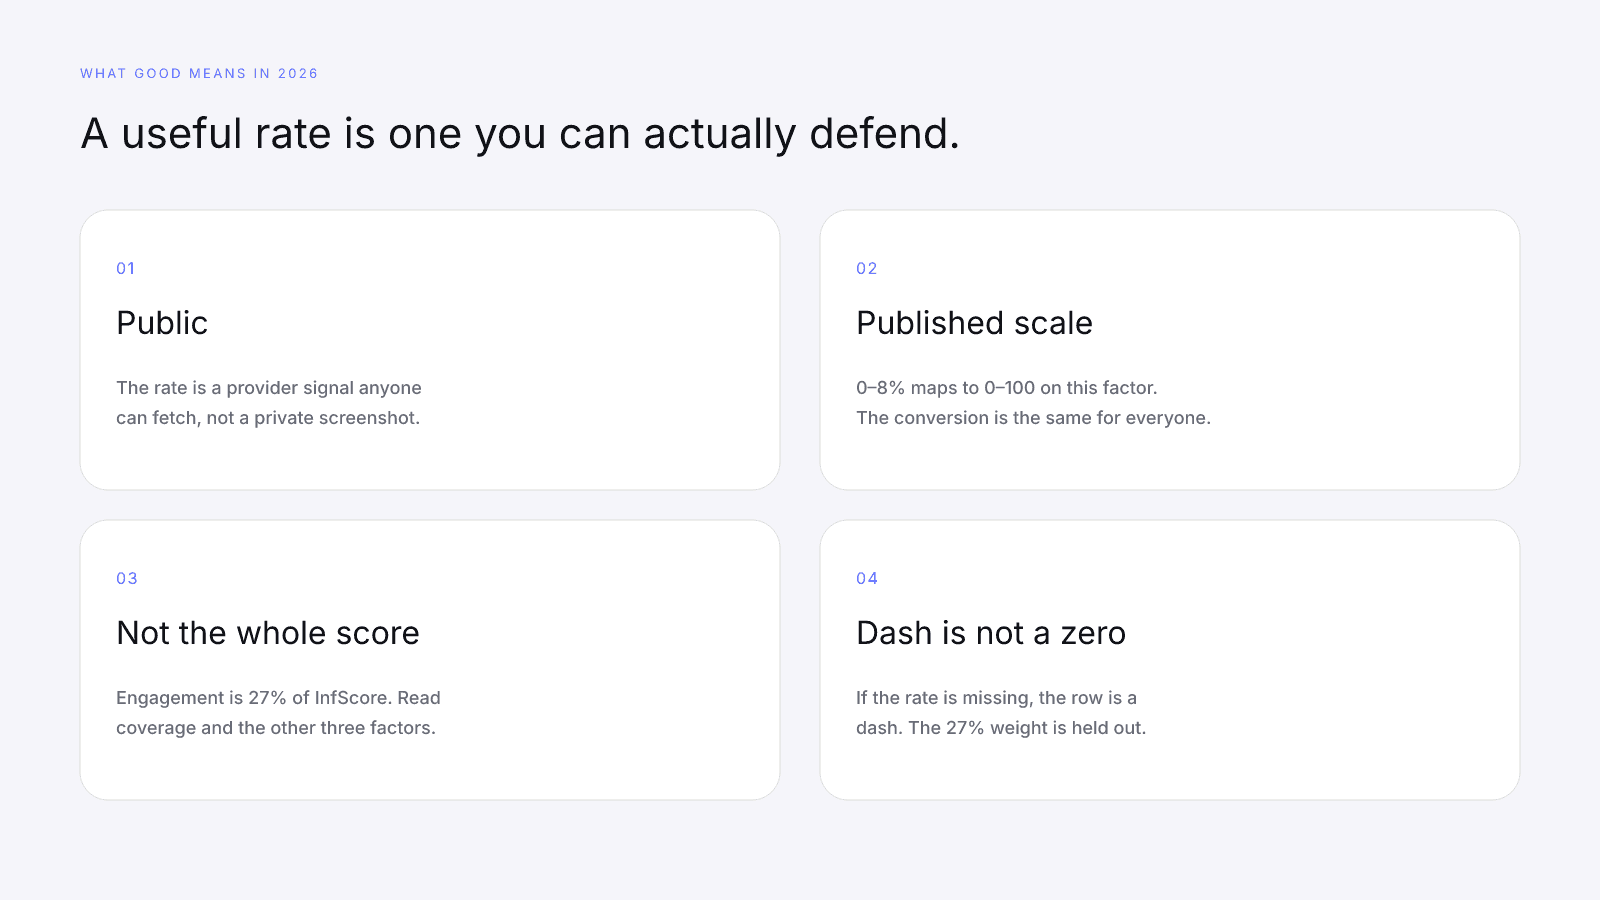
- The rate exists as a public provider signal, not as a private analytics screenshot.
- You know how that rate maps onto the published 0–8% scale.
- You also read scoring coverage and the other three factors. Engagement is 27% of the model, not the InfScore.
- You treat a missing rate as missing. A dash is a gap, not a failed grade.
Search any public creator on infscore.com. The free scorecard shows the headline rate when it exists, then the engagement-strength row.
Why a good rate is contextual in 2026
"Good" is the part people want as a single magic number. 2026 does not supply one. Platforms do not share one definition of a view, a like, or a meaningful comment. Audience size still changes how a raw ratio looks. A posting week is not a posting year.
InfScore does not paper over that with a secret good-for-your-niche table. It does not slide the scale because a vertical "usually" sits lower. It publishes one conversion for every public Instagram, TikTok, and YouTube profile on this model version, then leaves the judgment of "good enough for this decision" to the person reading the rest of the scorecard.
That is what contextual means here. The mapping is fixed. The reading is not. A 4% public rate is always 50 on the engagement factor. Whether that 50 is the story you need depends on audience quality, reach, platform coverage, and how much of the 32/27/23/18 mix actually participated.
Do not import a rumor to fill the gap. If someone tells you "5% is the bar in this niche," ask for the sample, the date, and the posting window. InfScore will not invent that bar for you.
Compare two scores only when you also look at the model id. If the formula changes later, the version string on the scorecard changes with it. A 50 on 2026-08-18.1 is a 4% public rate on this scale. A 50 on a later version might mean something else.
How InfScore scores the engagement factor
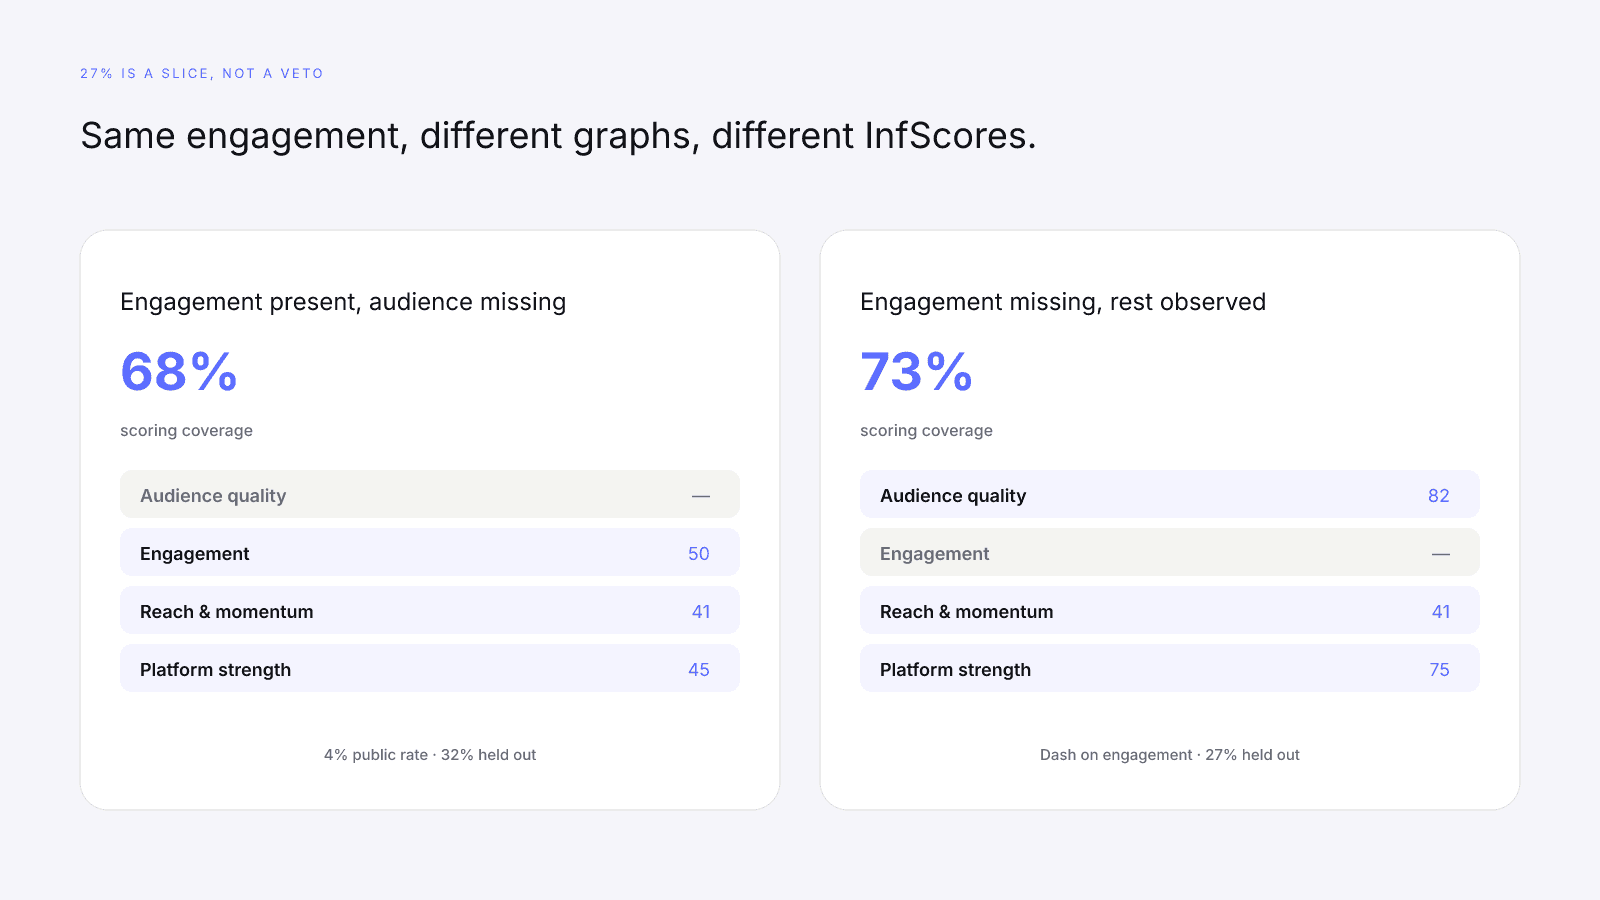
Engagement strength is 27% of InfScore when the rate is present. The displayed weights on the scorecard are the weights the current model uses: audience quality 32%, engagement 27%, reach & momentum 23%, platform strength 18%. Independently calculated still applies. A strong engagement row cannot lend points to a missing audience-quality row.
On model 2026-08-18.1, the public engagement percentage is divided by 8, multiplied by 100, then clamped to 0–100 and rounded. Eight percent is the published top. Null or non-finite input returns no factor score at all.
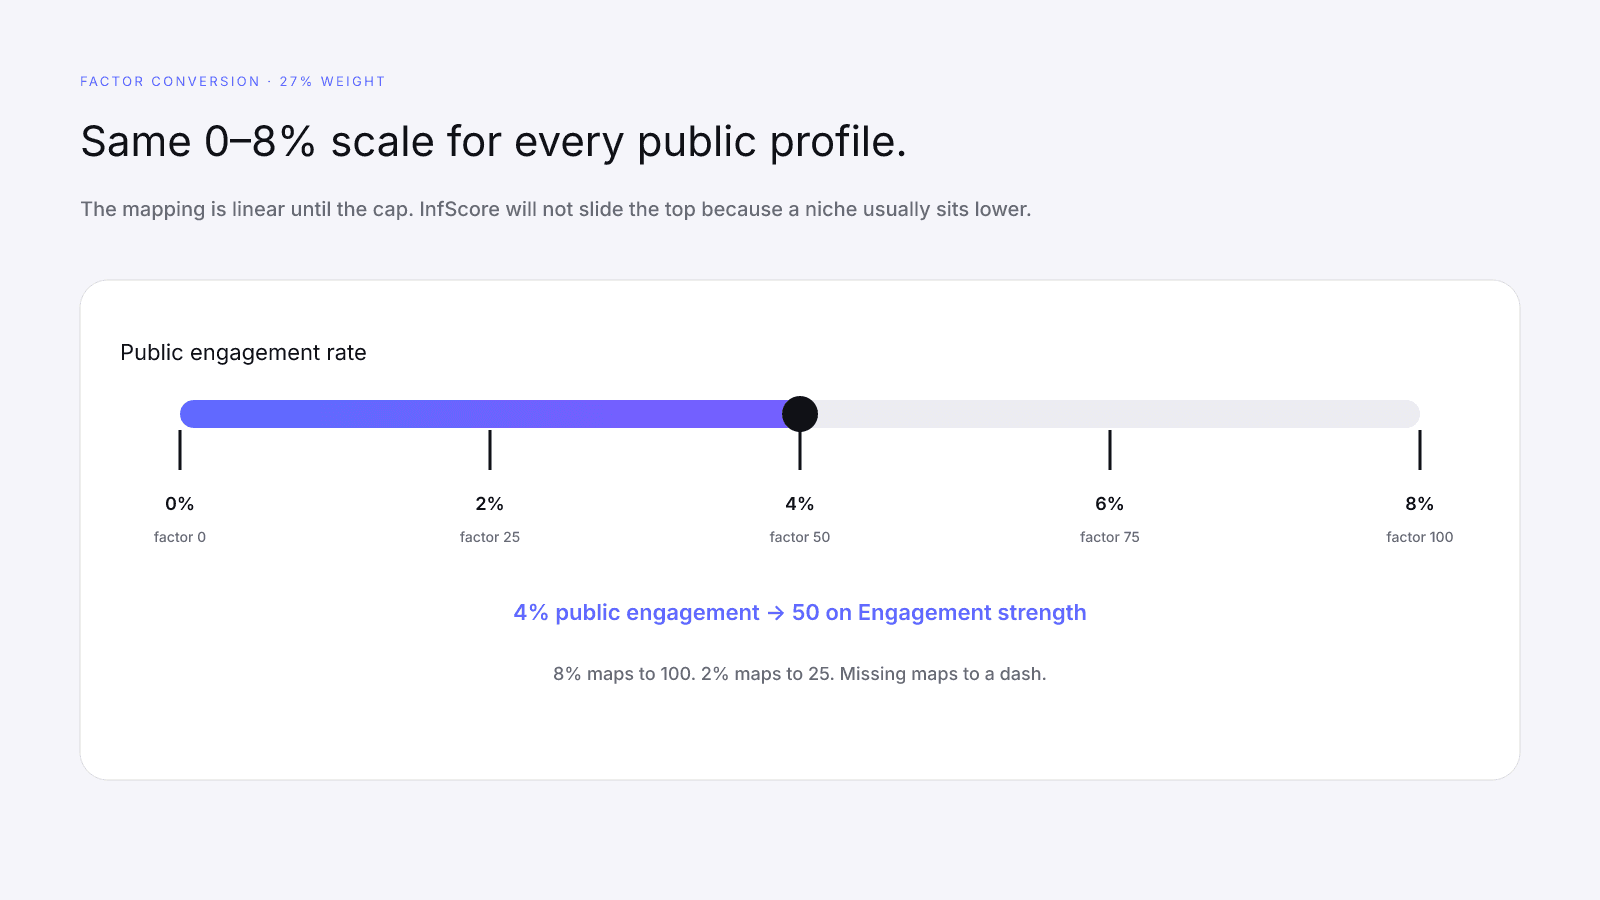
| Public engagement rate | Engagement strength |
|---|---|
| 0% | 0 |
| 2% | 25 |
| 4% | 50 |
| 6% | 75 |
| 8% | 100 |
| Above 8% | 100 (capped) |
| Missing | Dash (factor held out) |
That table is the product, not a niche ranking. A 4% public rate is 4 / 8 × 100 = 50. A 3% rate is 38 after rounding. A 5% rate is 63. A 1% rate is 13. A 7.2% rate is 90. A 12% rate is still 100, because 12 sits above the cap.
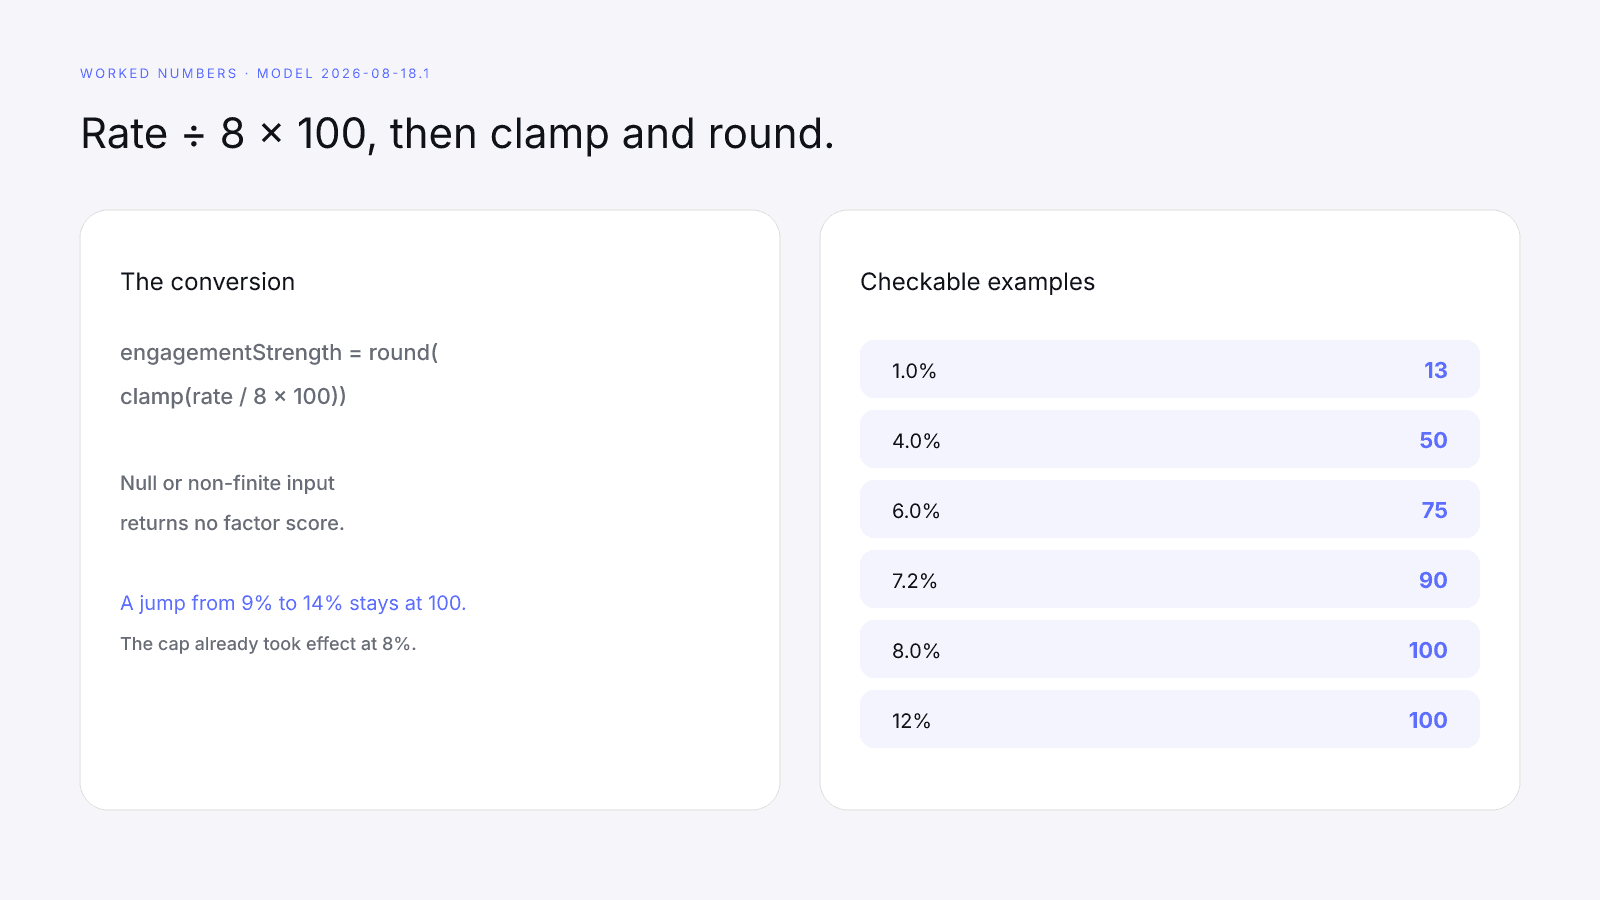
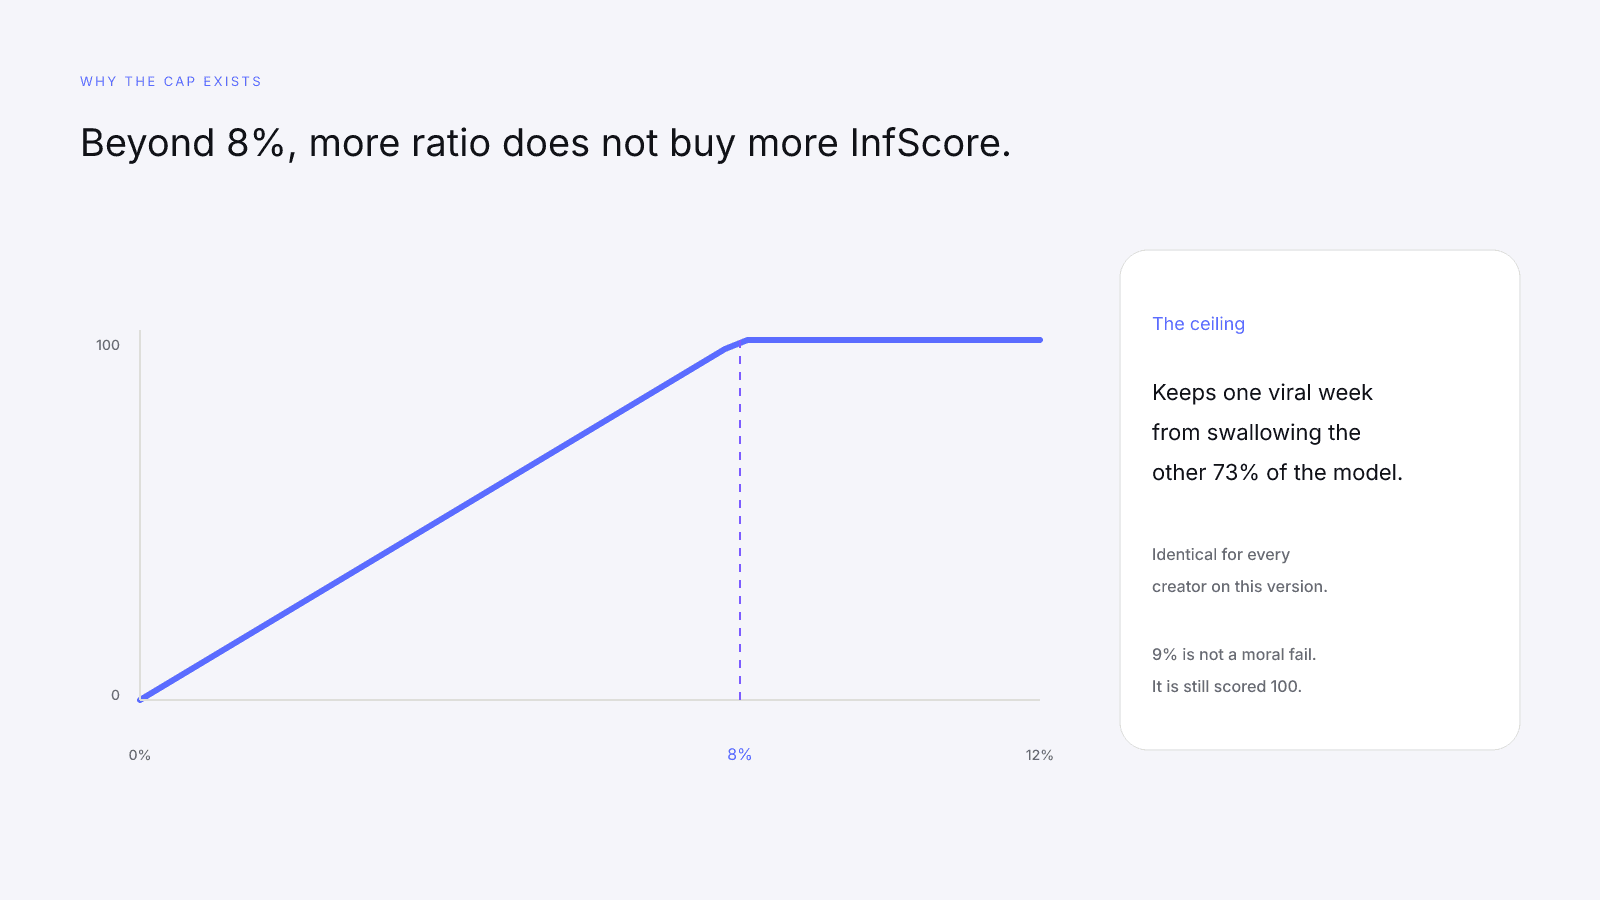
The cap keeps one viral week from swallowing the other 73% of the model. It is identical for every creator on this version. Nine percent is not a moral failure. It is still scored 100. A jump from 3% to 5% is a real move on this factor (38 to 63). A jump from 9% to 14% is not.
If engagement is missing, the row is a dash, not a quiet zero. The 27% weight is held out. Scoring coverage is the sum of the weights that actually participated. If engagement is the only gap, coverage is 73, because 32 + 23 + 18 = 73. InfScore will not borrow a likes-per-follower ratio from another platform to hide the blank.
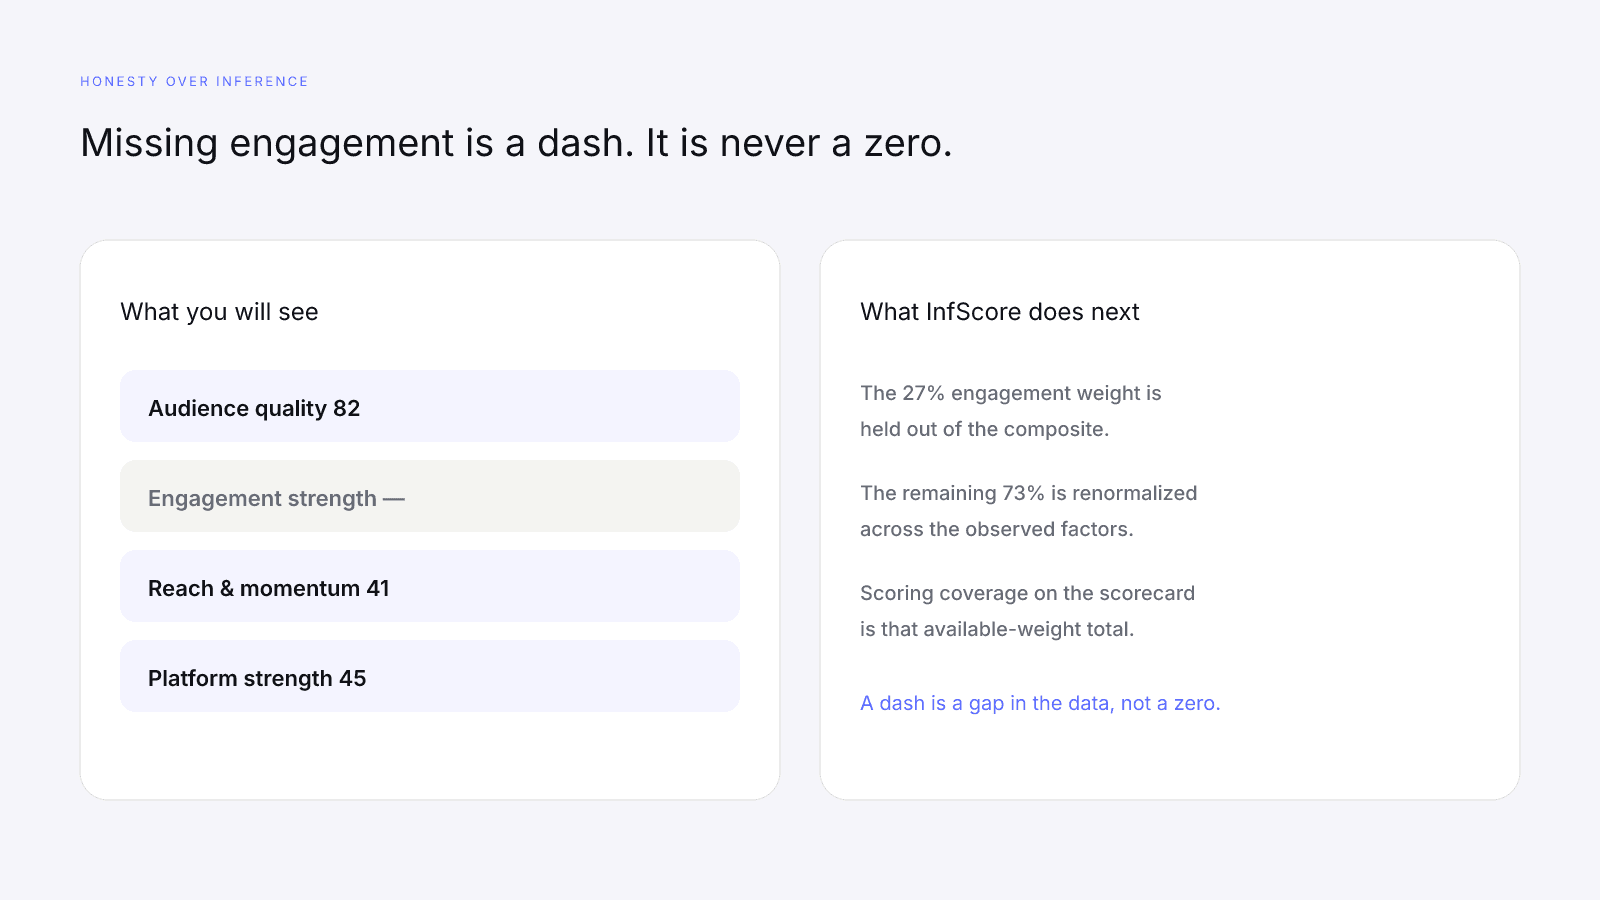
A dash is not an accusation. Providers do not return every field for every public profile. Treating missing data as zero would punish a provider gap. That is the opposite of the design.
When engagement is missing, read the other factors first. They are still real. Then read scoring coverage. Do not assume the missing row would have been high, or low. You do not know.
Open a live score and read the row rather than quoting a homepage card. The MrBeast YouTube score is a public scorecard. Example tiles on the homepage are illustrative; a score URL is the product. You can also open Emma Chamberlain on Instagram the same way.
Read engagement with the other factors
A 50 on engagement is a 4% public rate on this scale. It is not a 50 InfScore. The composite is a weighted average of the observed factors only.
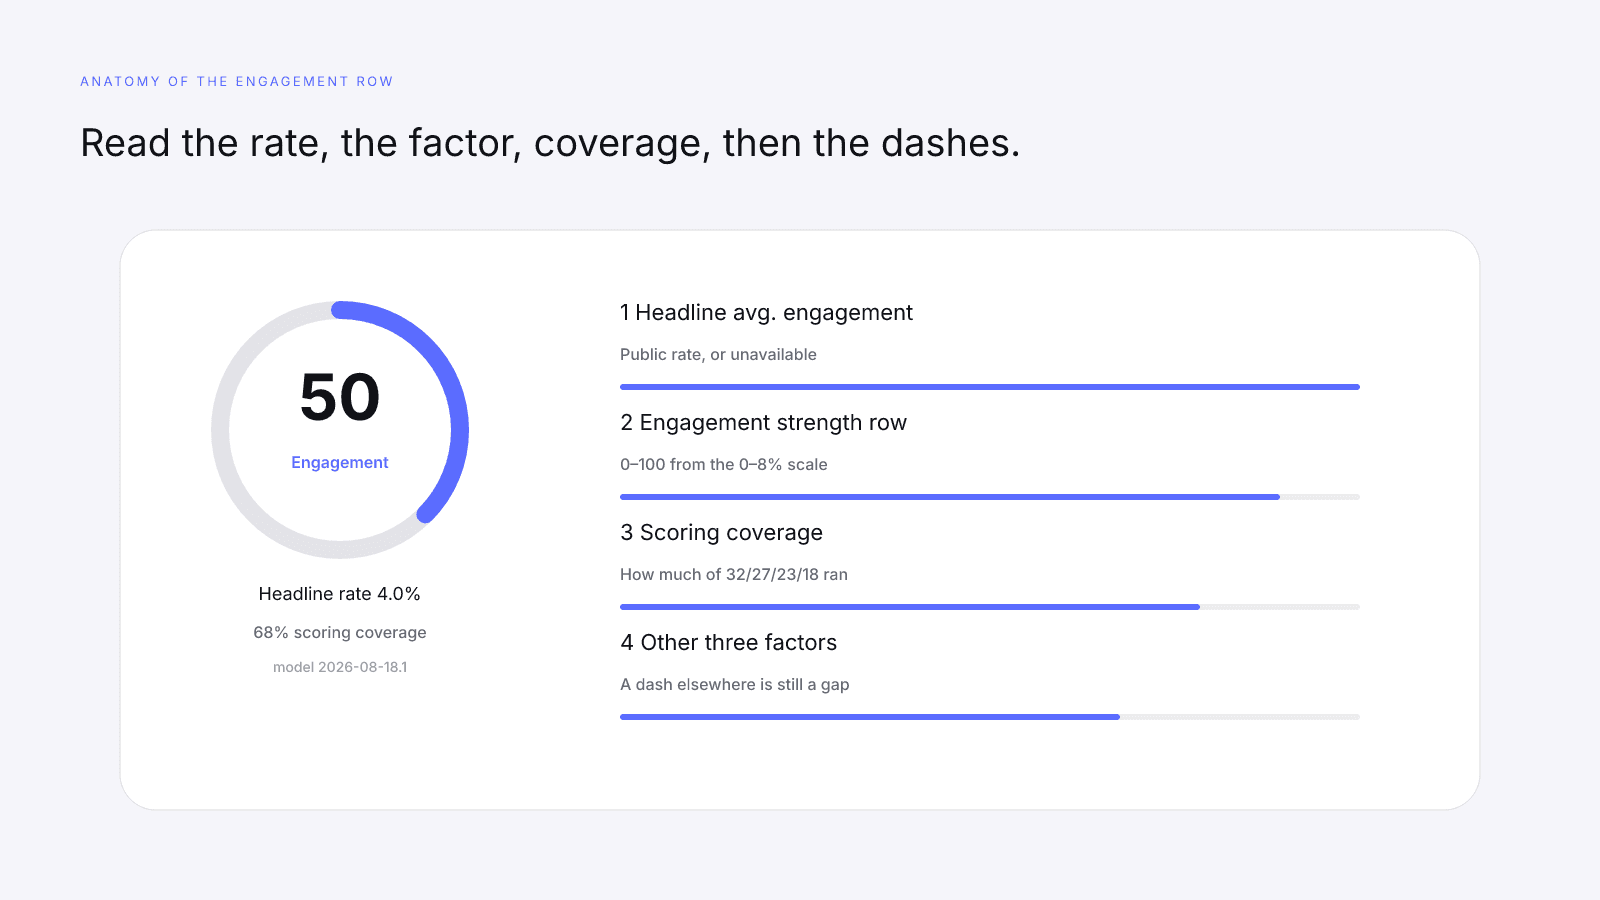
Read the free scorecard in this order:
- Headline avg. engagement. Public rate when the provider returned it, or unavailable.
- The engagement-strength row. 0–100 from the 0–8% scale, or a dash.
- Scoring coverage. How much of the 32/27/23/18 model ran.
- The other three rows. A high engagement factor next to a dashed audience-quality row is incomplete.
- Model version. Same formula, same comparison; different version, different conversation.
Two creators with the same headline engagement can have different InfScores. A higher number with 50% coverage is not better by default than a slightly lower number with 100% coverage. Coverage is part of the reading.
When you screenshot a score, include the engagement row, the coverage line, and the model id. A bare percentage without those three facts is an incomplete citation.
The public InfScore stays free. The denser report is a one-time $0.99 unlock, not a subscription. Pricing is one report, one dollar, no recurring fee. Paying does not purchase a friendlier engagement scale, fill a dash, or move the 8% cap. It adds provider modules when they exist.
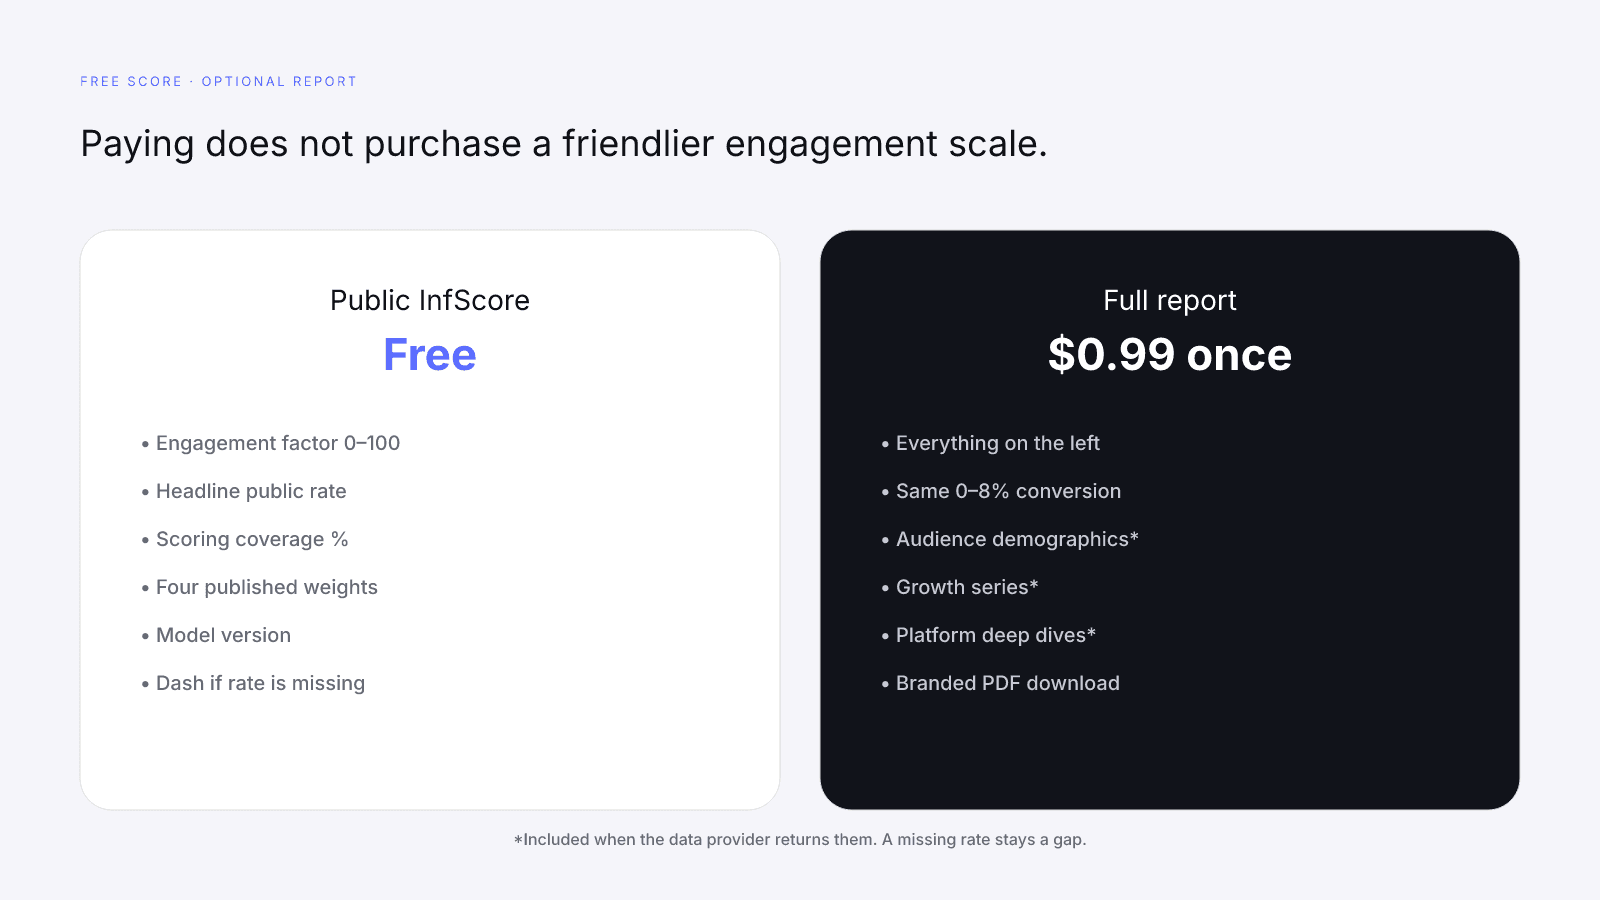
Use the paid report when you need to explain the score to someone else. Use the free score when you need the comparable number quickly. Both views are honest about gaps.
A public-signal checklist
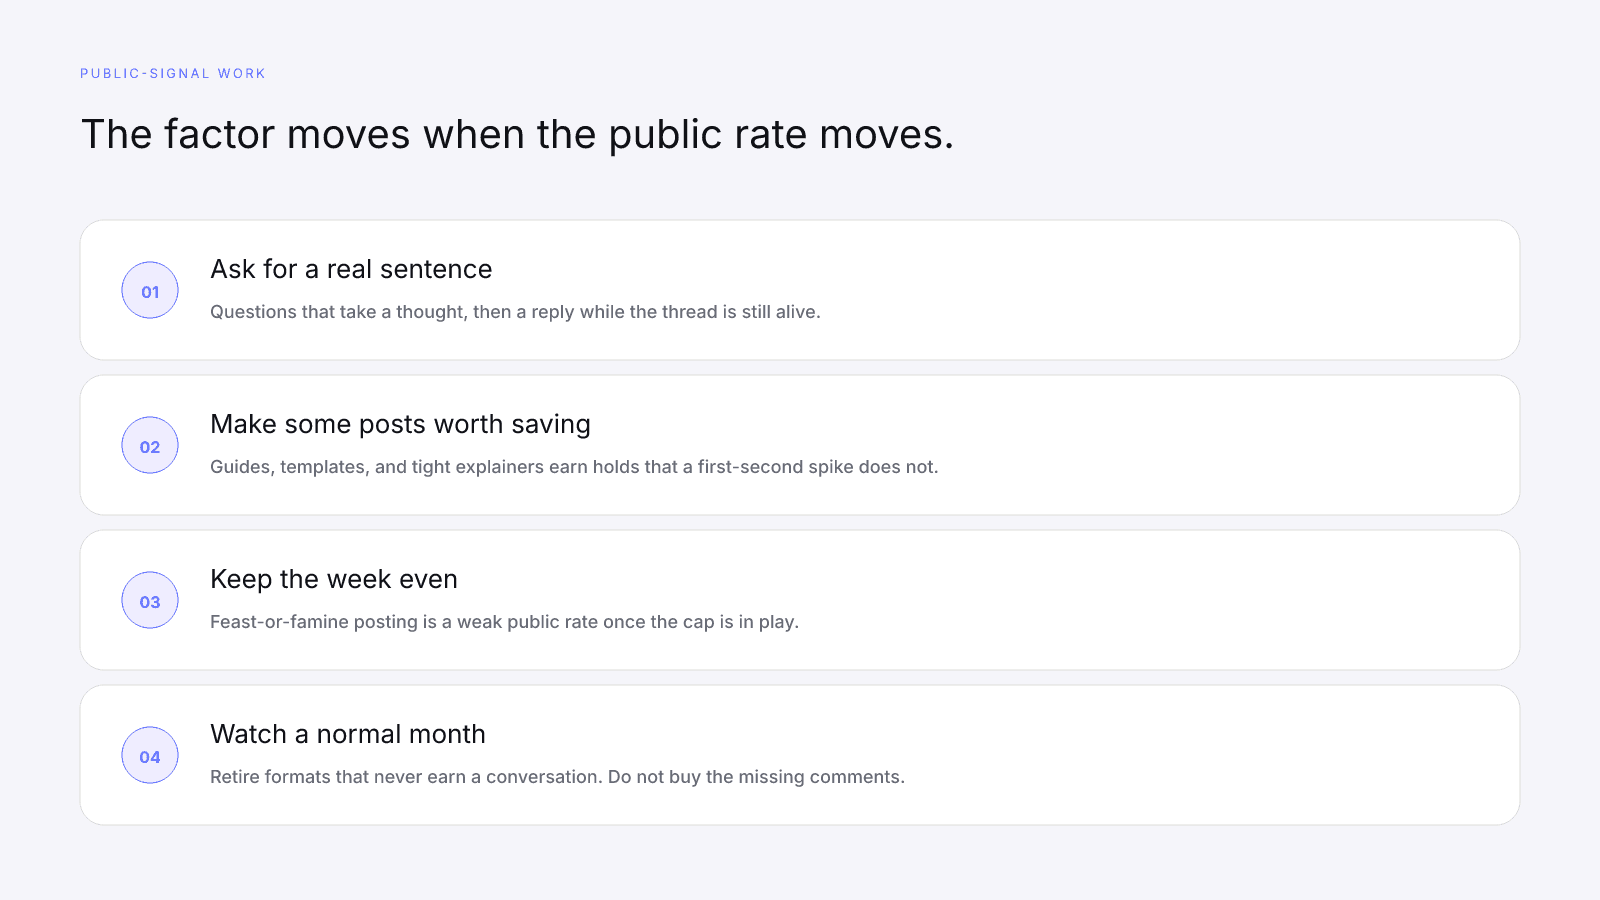
The only way the engagement factor moves is if the public rate moves. That work is slower than a pod, and it is the work the model can actually see.
- Search yourself on InfScore the same way a stranger would.
- Write down the headline rate, the engagement factor, coverage, model id, and any dashed rows.
- If engagement is a dash, ask whether the public profile actually exposes that signal.
- If engagement is scored, change the public work: ask for comments that take a sentence, reply while the thread is alive, publish some posts worth saving, and watch a normal month instead of a single spike.
- Keep posting quality closer to even than to feast-or-famine. A single viral ratio does not define the factor once the cap is in play.
- Re-check after a normal month of work, not after one post.
- If you need the denser modules, the full report is $0.99 once. If you do not, the free score is the product.
None of this requires disclosing private analytics. InfScore is scoring what is already public.
What will not produce a good rate
Skip these. They waste money and they usually make the public graph worse.
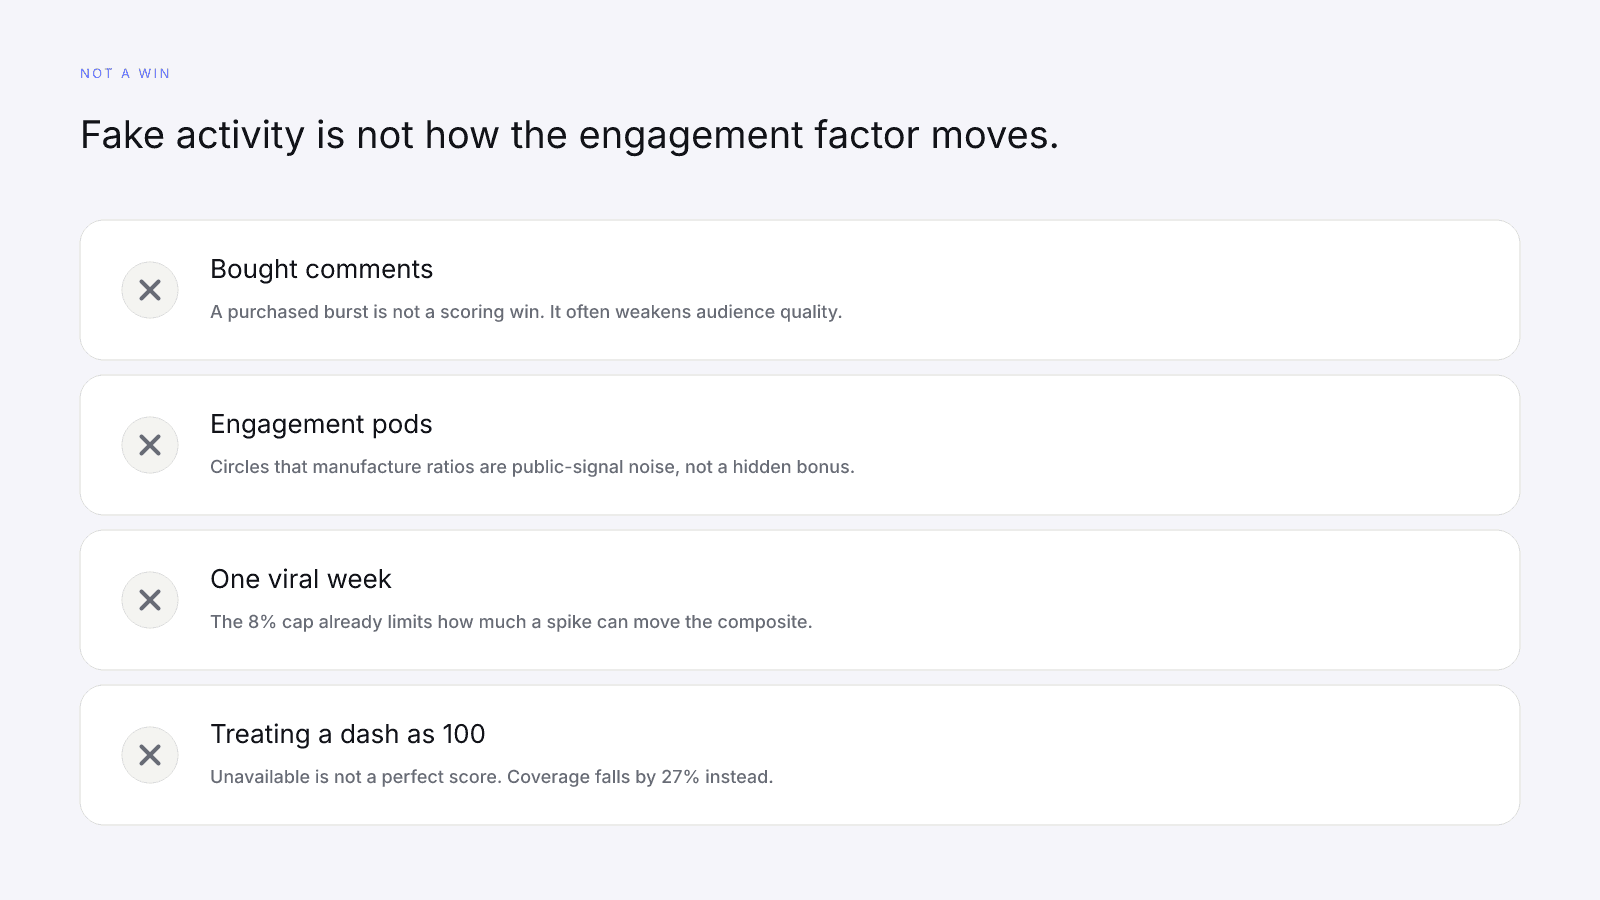
- Buying likes, comments, views, or a one-week ratio spike.
- Comment pods and engagement circles designed to manufacture activity.
- Private-account tricks meant to hide a weak graph while keeping a public handle searchable.
- Arguing that a dash should be scored as 100 because you "know" the comments are real.
- Treating a single viral post as the new baseline. The cap already limits how much one burst can do.
Bought engagement will not quietly improve this model. More often you pay for a noisier audience-quality row and a ratio that may not hold. If the public signals improve later, the versioned model will pick that up the next time the profile is fetched. If they do not, the number should stay put.
A good engagement rate in 2026 is still a public rate on a published scale, read next to coverage and the other three factors. InfScore is the part that holds still long enough to compare.
FAQ
What is a good engagement rate in 2026?
There is no universal good percentage. A useful reading is a public engagement rate on a published scale, next to the rest of the score. InfScore maps that public rate onto a fixed 0–8% scale as 27% of a versioned 0–100 composite.
How does InfScore score the engagement factor?
Engagement strength is 27% of InfScore when the rate exists. The public engagement percentage is converted on a fixed 0–8% scale, then mixed with audience quality 32%, reach and momentum 23%, and platform strength 18%.
What is InfScore's 0–8% engagement scale?
On model 2026-08-18.1, public engagement is divided by 8, multiplied by 100, clamped to 0–100, and rounded. Four percent maps to 50 on the factor. Eight percent maps to 100. Values above 8% stay capped at 100.
Is 3% or 5% a good engagement rate?
Neither number is universally good or bad. On the current InfScore scale, 3% maps to 38 and 5% maps to 63 on the engagement factor. That factor is 27% of the composite, so the rest of the scorecard still has to be read.
Why isn't engagement rate enough on its own?
Engagement is one published factor, not the InfScore. Audience quality, reach and momentum, and platform strength still participate when those signals exist. A high ratio with dashed coverage is an incomplete reading, not an automatic win.
Do engagement pods help InfScore?
No. Comment pods and bought activity are not a scoring win. They can inflate a raw ratio for a moment and still leave a weaker audience-quality row. InfScore is built from observed public signals, not from manufactured comments.
Is the engagement factor on the free public score?
Yes. The free InfScore already includes the engagement factor, the headline public rate when it exists, scoring coverage, and the model version. The optional $0.99 report adds denser provider modules. Paying does not purchase a different 0–8% scale.