Instagram vs TikTok vs YouTube: Which Platform Fits Your Campaign?
Instagram vs TikTok for influencer marketing, plus YouTube: choose by format, audience, and deliverables, then read each card on the same InfScore model.
This versioned composite uses only available public signals. Missing factors stay unavailable and their weight is rebalanced across observed factors. It is not a percentile, price estimate, or guarantee of campaign results. Model 2026-08-18.1.
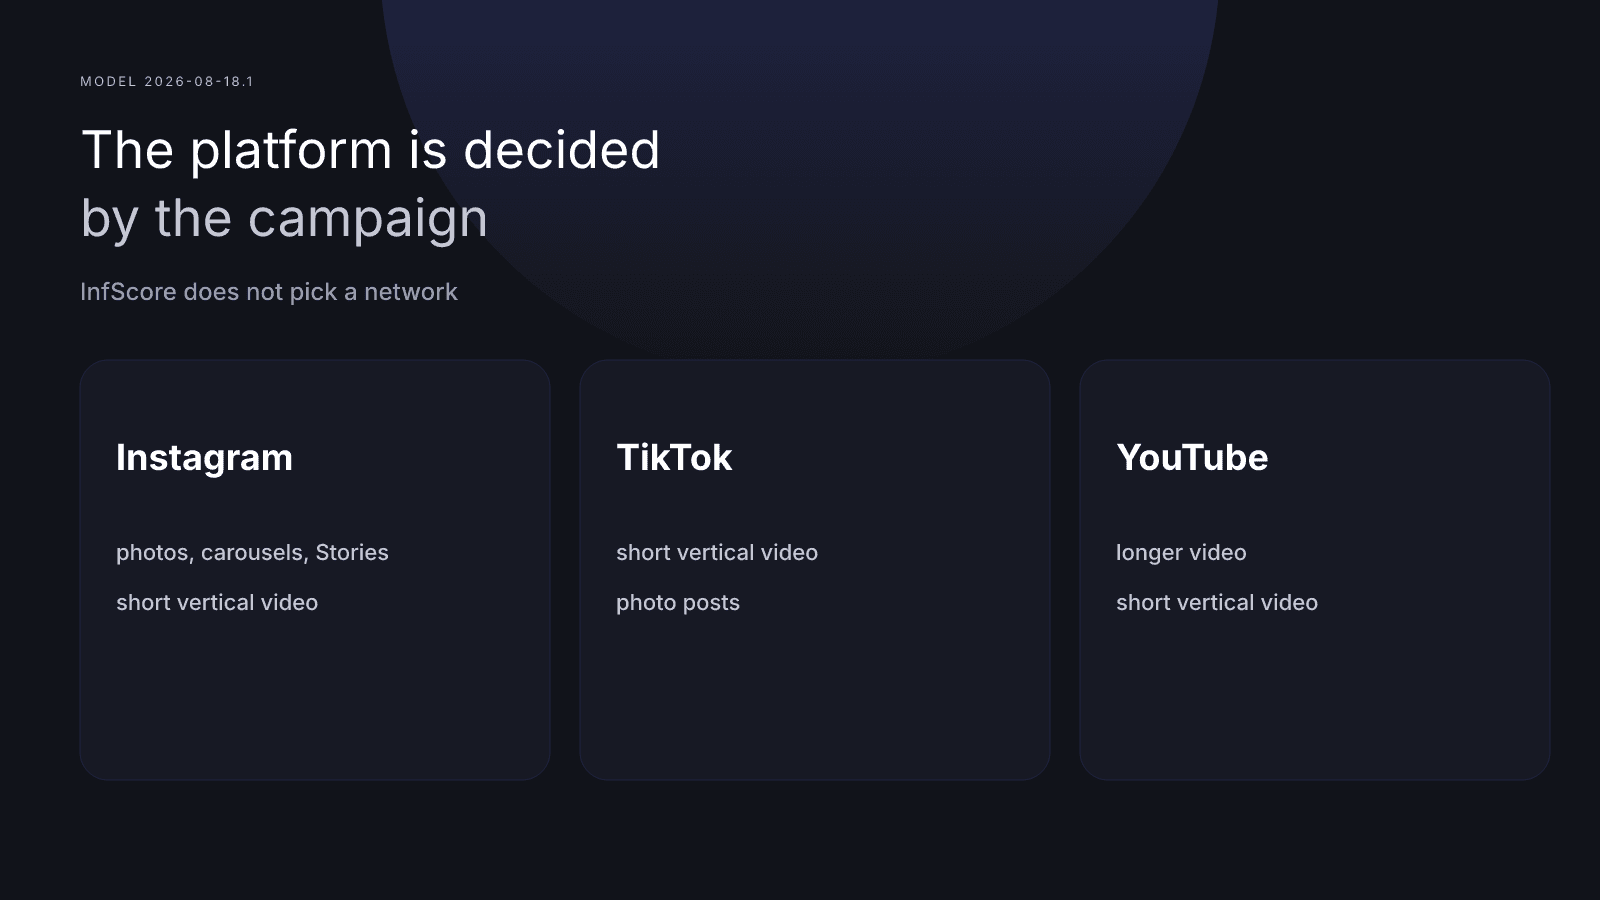
Instagram vs TikTok for influencer marketing starts with the work, not with a leaderboard. The platform is decided by the campaign: the format you need, the audience you are after in the creator's own words, and the deliverables you agree. The brand decides that. InfScore does not pick a network, and it does not rank Instagram, TikTok, or YouTube against each other.
The same composite runs on every lookup surface. On model 2026-08-18.1 each card reads public, provider-reported signals for the platform you looked up. Once you have picked the platform, look the creator up on that platform and read that card. A card for a different app is a different reading, even when the handle looks the same.
Instagram vs TikTok for influencer marketing: start with the campaign
Choosing an influencer platform is a planning conversation. Adding YouTube puts a third app in that conversation. It does not add a step where a score sorts the apps. The brand names what the post has to be. The creator says what they are willing to make. The card tells you how the public signals for one app read on the published model.
Name the job, the app that can host it, and the person who will agree the pieces before you search a handle. A score can sit beside that note. It cannot supply the note. If the job is still "be on social," you do not yet have a platform decision.
When a teammate asks whether TikTok or Instagram influencers are better, translate the question back into format, audience, and deliverables. The work is a placement, not a contest between two groups of people. A creator can fit the app that hosts the piece and fit poorly on an app that hosts a different piece. You learn that from the creator, then you read the card for the app you plan to use.
Agree the format, ask who they say watches, write the deliverables, then open the public card for that app, including any dash.
Format and deliverables decide the platform
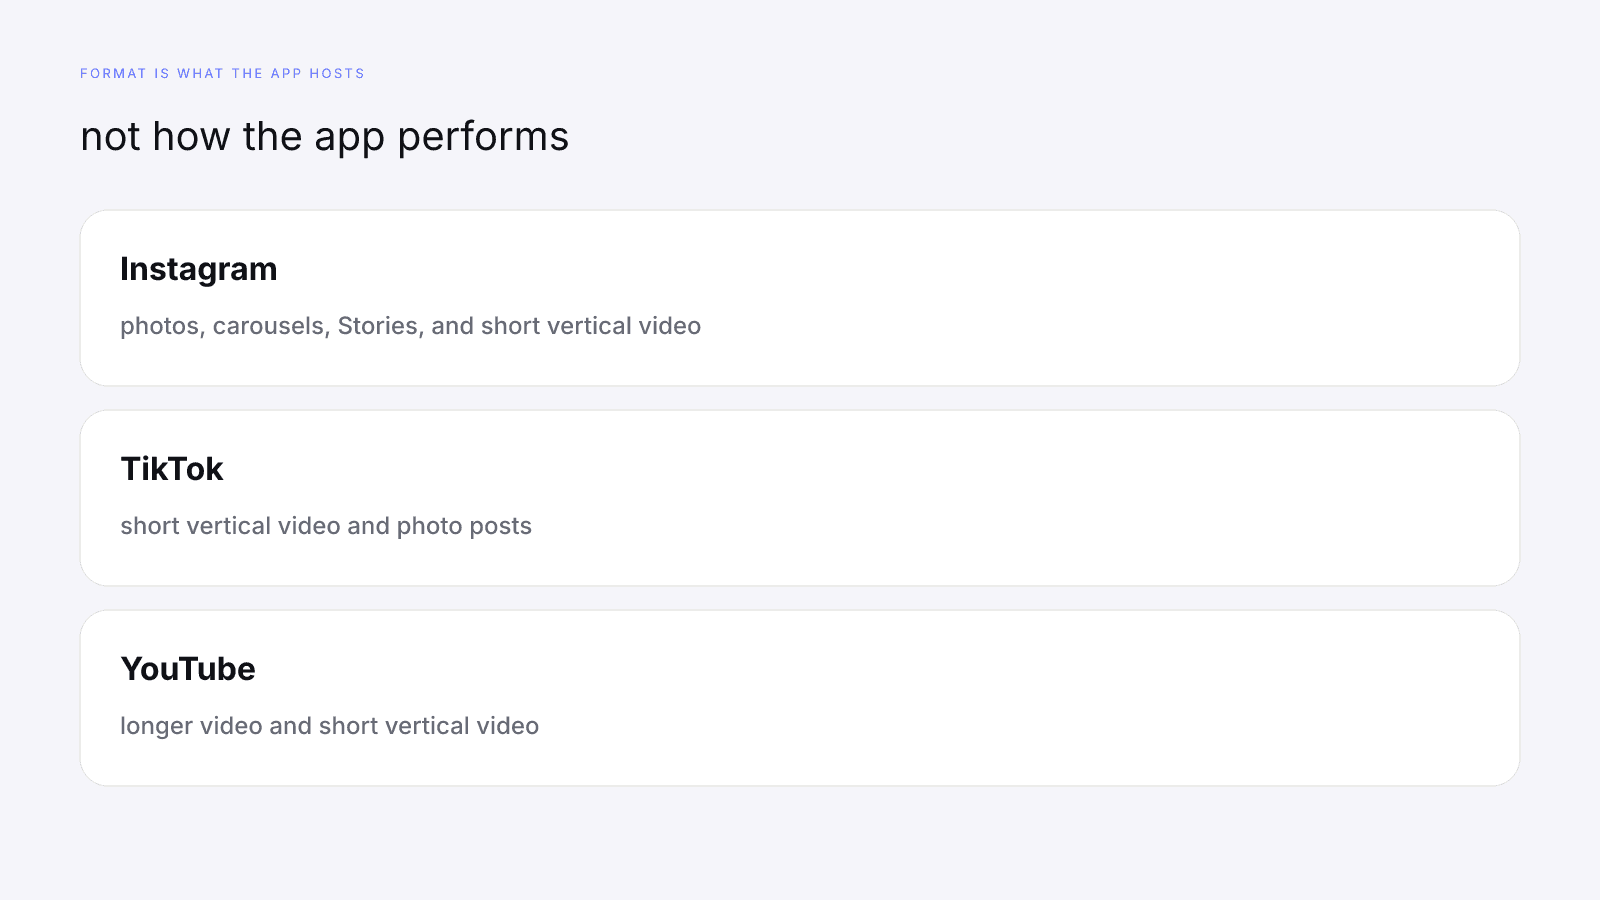
Format is what the app hosts, not how the app performs. Instagram hosts photos, carousels, Stories, and short vertical video. TikTok hosts short vertical video and photo posts. YouTube hosts longer video and short vertical video. Each app hosts more than this list, and the menus change, so confirm the placement in the app before you agree it. None of those sentences is a claim about which placement will work harder. They only name the kind of file the campaign is asking someone to make.
A YouTube vs Instagram influencer campaign is still that format choice. Longer video belongs on the app that hosts longer video. A photo, a carousel, or a Story needs an app that hosts that placement. Short vertical video is a format more than one of these apps can host, so the format alone does not finish the choice. You still need the audience sentence and the deliverables before you pick which short-video placement you are buying.
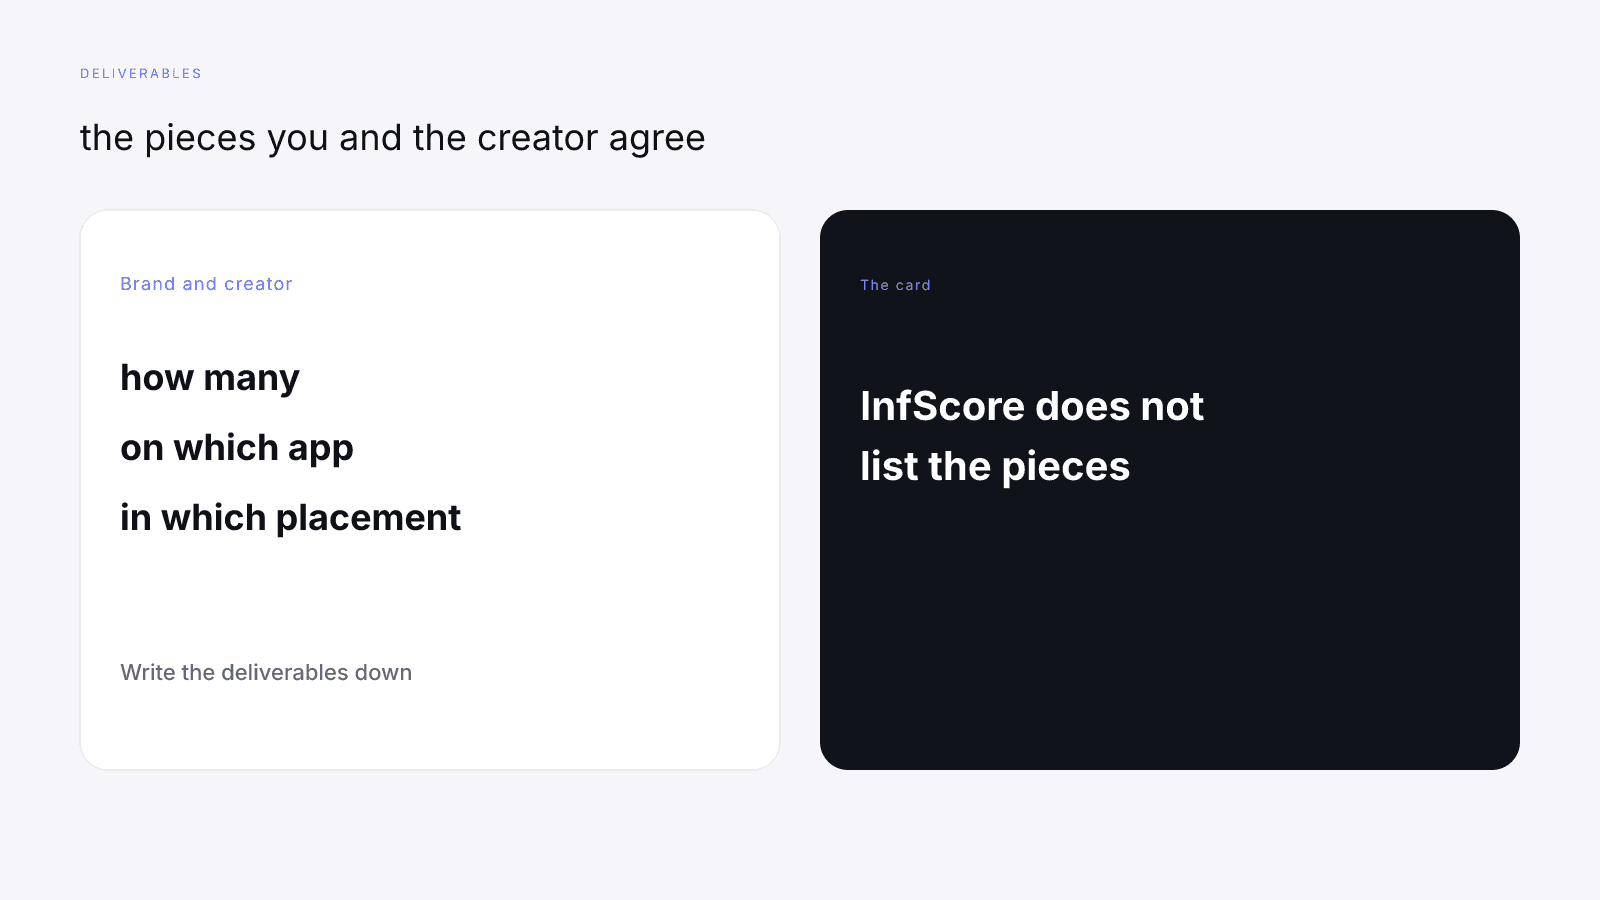
Deliverables are the pieces you and the creator agree: how many, on which app, in which placement, and what has to appear in them. InfScore does not list the pieces, and it does not know the product or the line the brand needs said. If the deliverables name Instagram, read the Instagram card. If they name TikTok, read the TikTok card. A YouTube card for the same handle is a different page.
Match the public URL to that app. A lookup carries the platform you asked for. Reading whichever card opens first can attach an Instagram reading to a TikTok deliverable. The composite is still a reading of the card you opened. It is the wrong card for the work.
Write the deliverables down with the creator. What to Put in an Influencer Brief (With a Template) is where those agreed lines go, next to a score section copied from the card. The platform in the deliverables and the platform on the card are the same.
If the creator cannot make the format, the platform does not fit, whatever the card says. A strong reading of a photo account does not turn that account into a longer-video placement. A missing row does not mean the creator refused the format.
The audience you need, in the creator's words
The audience line is who the creator says watches, in their words. It might be people who cook on weeknights, people who review running shoes, or a community around a game. That sentence comes from the creator. InfScore does not write it, and the composite does not imply it.
Audience quality is a different sentence. On the card it is a number, or a dash, for the platform you looked up. It is a provider-reported signal about that public audience when the data provider returns it. It is not a paraphrase of the creator's description, and the creator's description is not a substitute for the row.
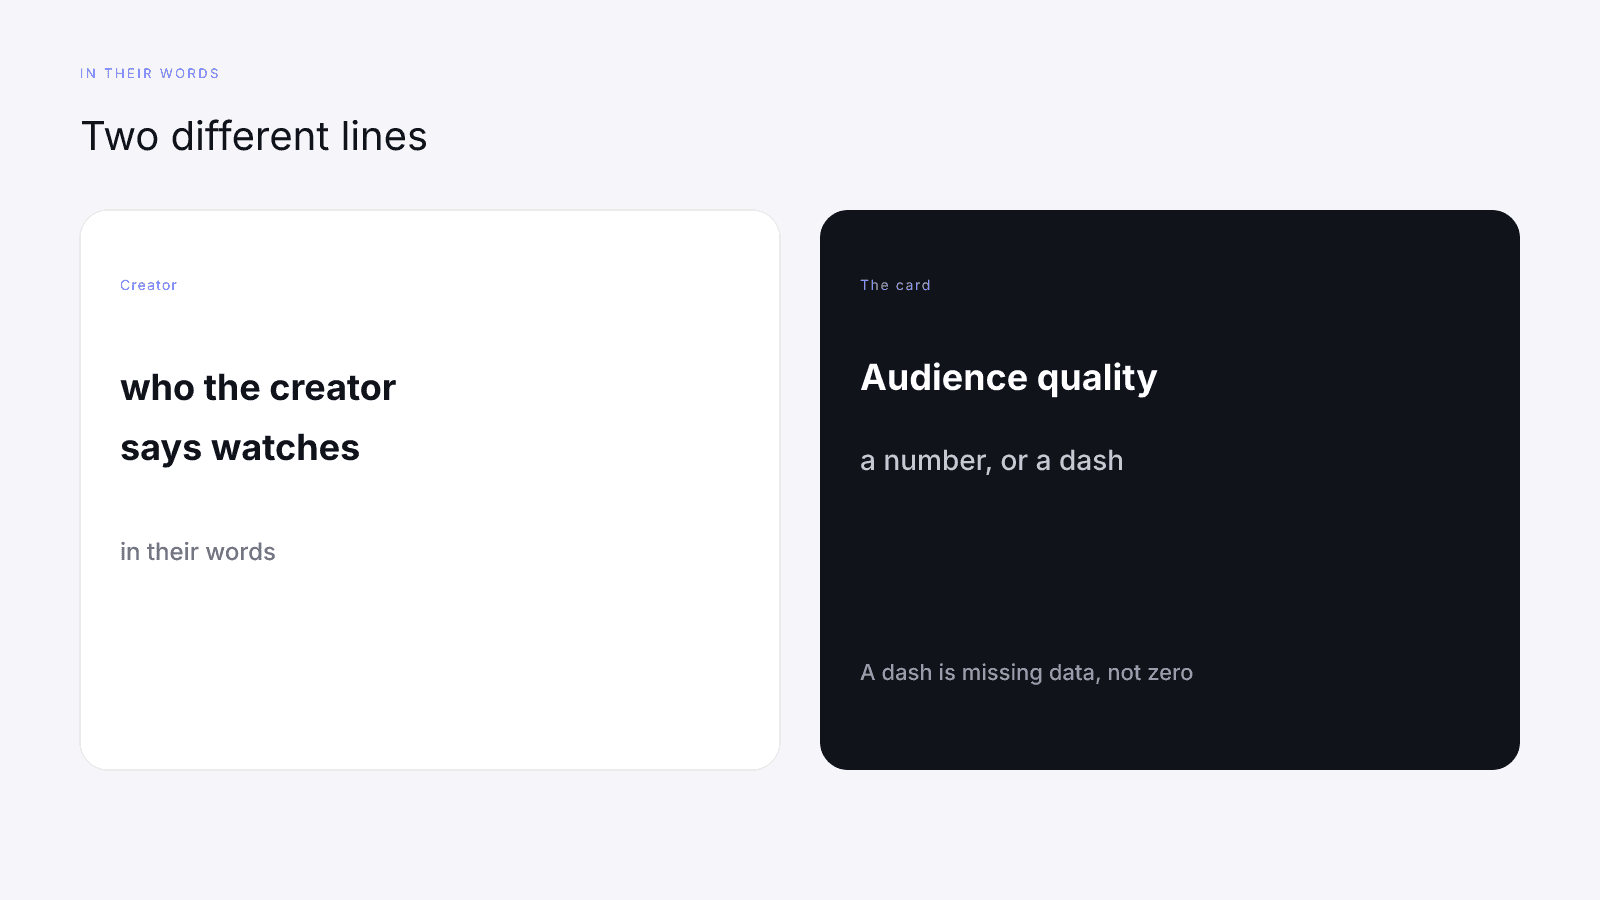
Two different lines. Keep them apart in the file. If audience quality is a dash, write that the row is missing. Do not let the creator's sentence fill the dash, and do not borrow a number from a different platform's card. A dash is missing data, not zero, and its weight is held out.
Ask in the creator's language. "Who do you think is watching this account?" gets a sentence you can put next to the deliverables. The card will not grade that sentence. You will, against the people the campaign needs to reach.
The same creator can describe different audiences on different apps, because the profiles are different. Read the description that matches the deliverables, then read the card for that same app. If the creator's sentence and the campaign's customer have nothing in common, the platform does not fit, even when every row on the card came back with a number.
One InfScore model on every platform
There is one formula. On model 2026-08-18.1 the weights are audience quality 32%, engagement strength 27%, reach & momentum 23%, and platform strength 18%. Those weights are the same on Instagram, TikTok, and YouTube. The methodology publishes them. How to Measure Influencer Performance walks through the four factors.
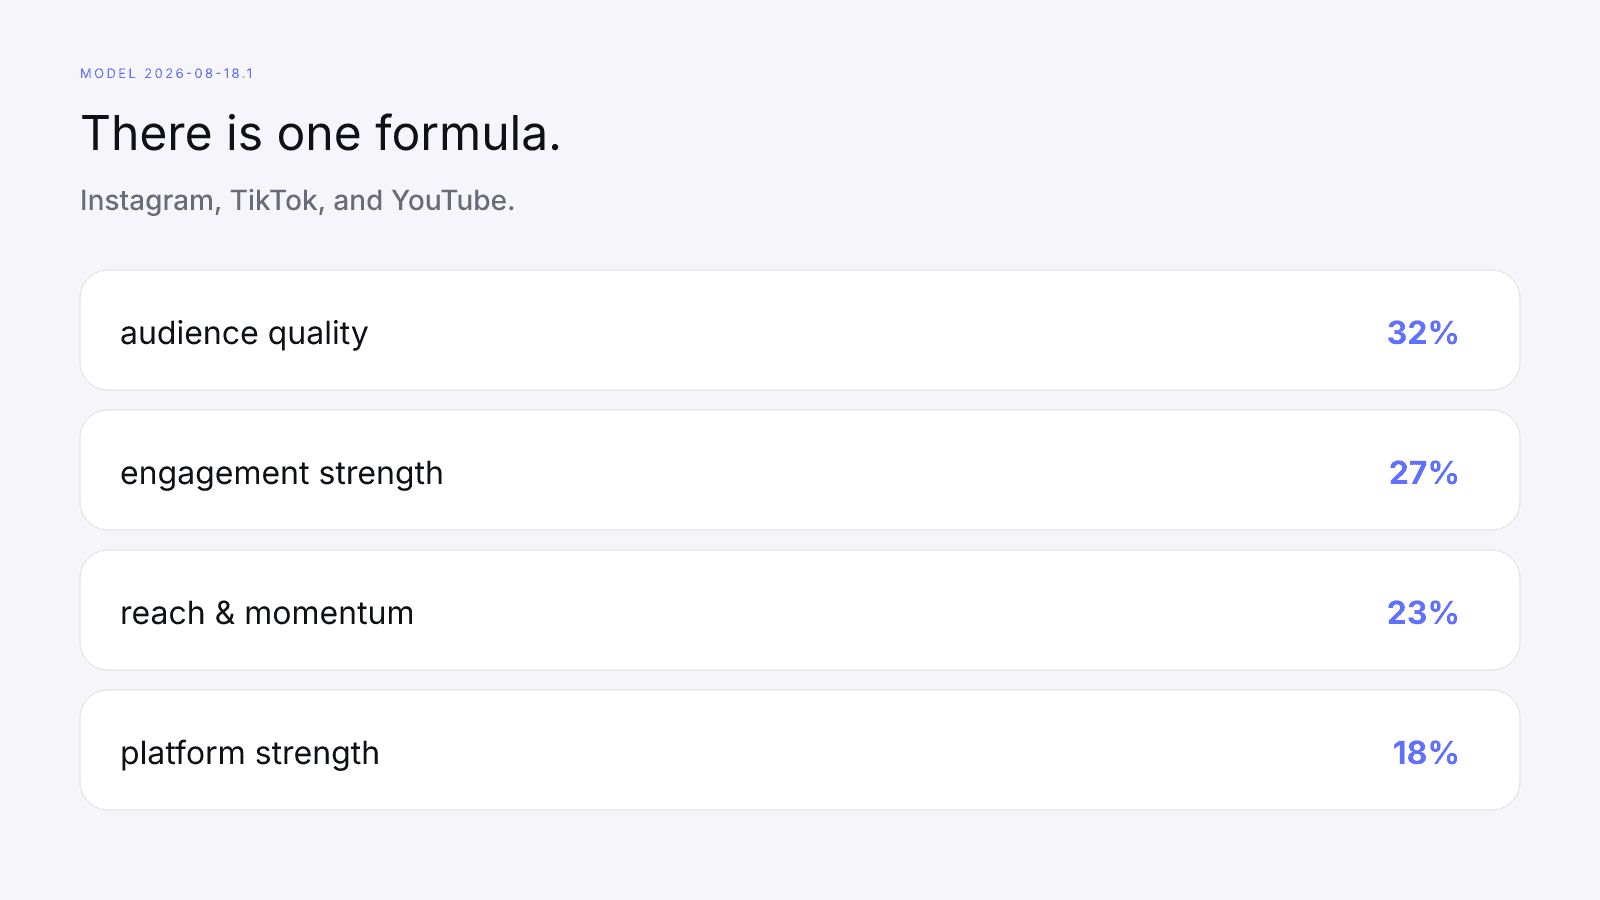
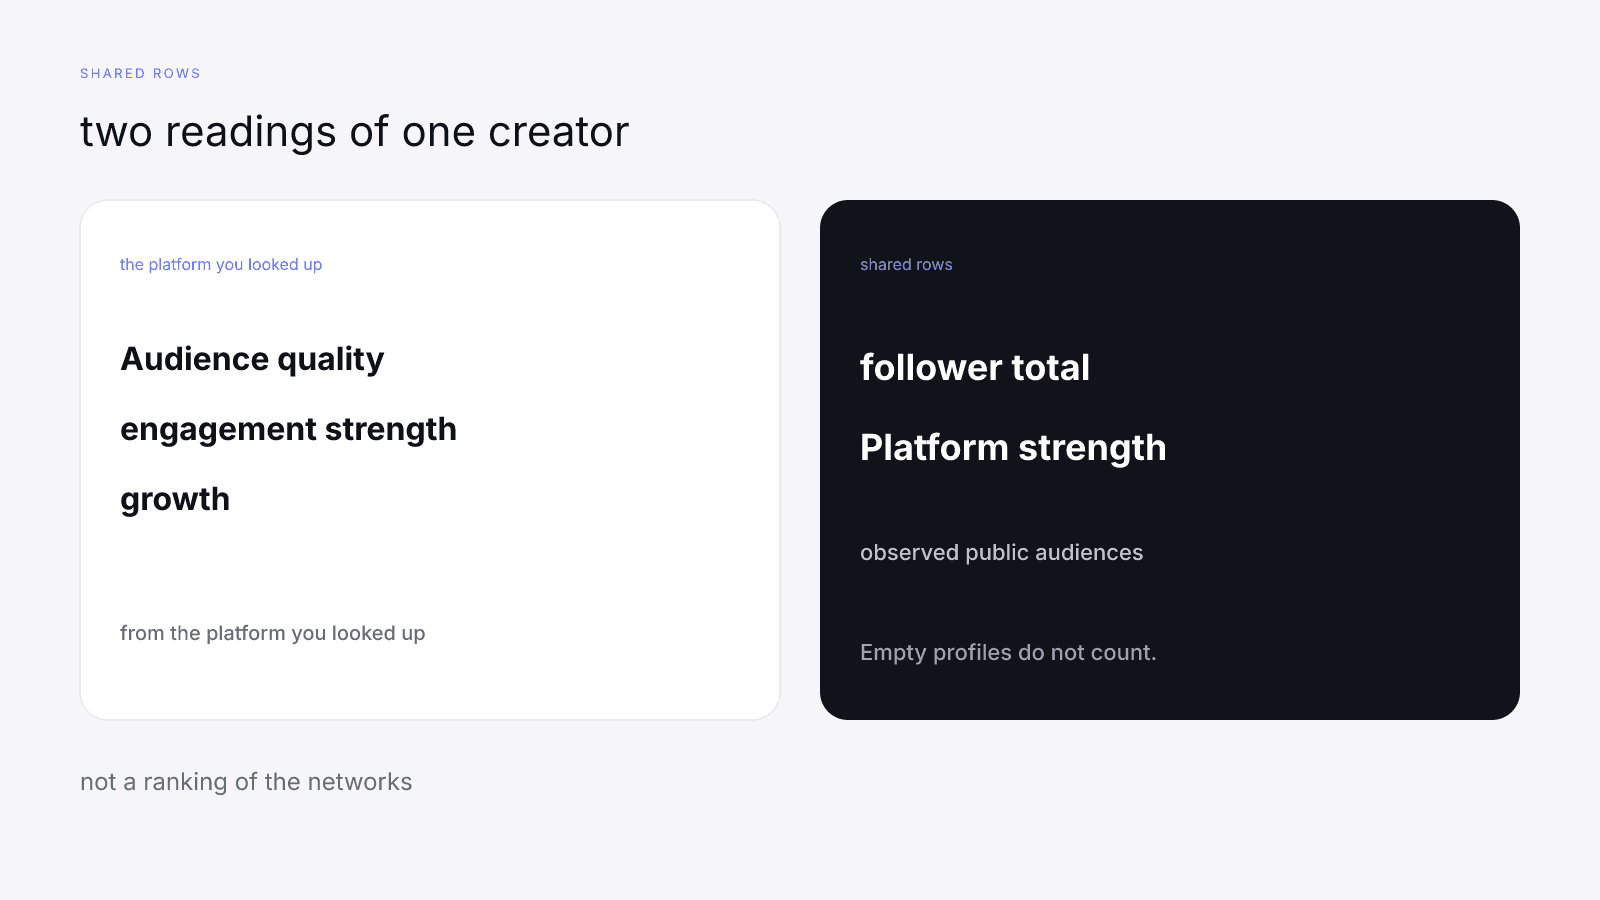
What changes from card to card is where some of the inputs come from. Audience quality, engagement strength, and the growth part of reach & momentum come from the platform you looked up. The follower total behind reach & momentum is the sum of the observed public audiences across Instagram, TikTok, and YouTube. Platform strength counts those same observed public audiences. Empty profiles do not count. Two cards for one creator can show different composites because the platform rows differ. The shared rows should match when both cards were read at the same time. That is two readings of one creator, not a ranking of the networks.
InfScore does not calculate engagement. It maps the provider-reported public rate for the looked-up platform onto a fixed 0-8% scale. On that scale, 4% maps to 50, and 8% maps to 100, with a higher reported rate staying at 100. The same scale is used on every platform.
Reach uses a log scale. About 1,000 followers maps to 0 on that piece, and 100 million maps to 100. When the requested platform has a provider-reported 12-month follower growth figure, reach is blended 70/30 with momentum from that growth. When it doesn't, the row is the log of the follower total alone. A follower total of 1,000,000 with no 12-month growth figure maps to 60.
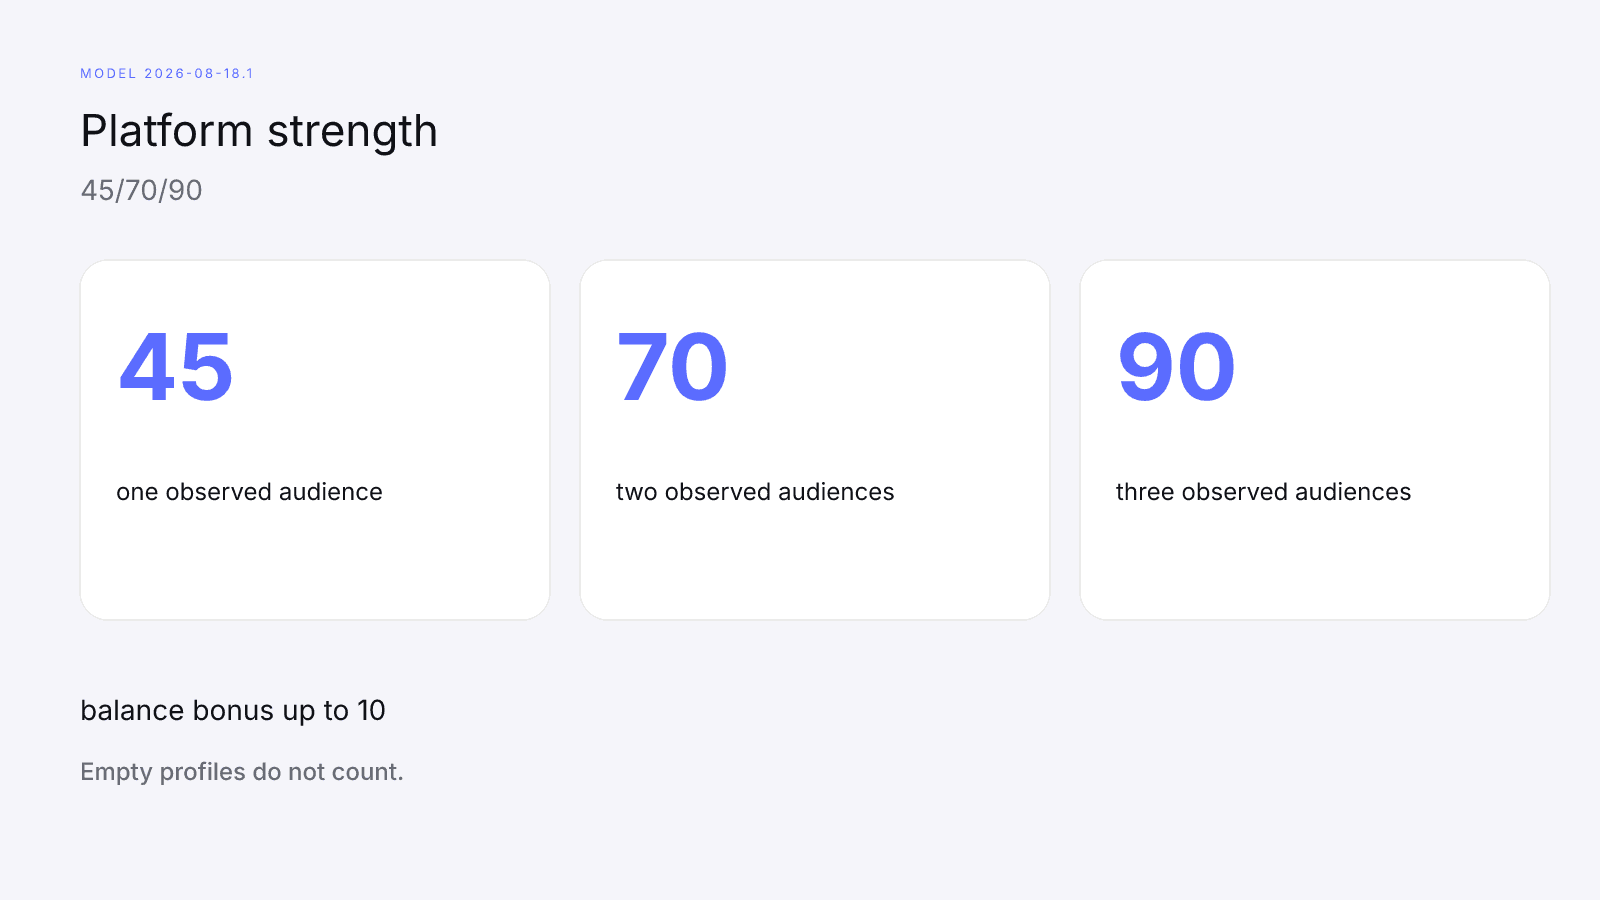
Platform strength uses floors of 45 for one observed audience, 70 for two observed audiences, and 90 for three observed audiences, plus a small balance bonus up to 10 when the counts are not lopsided. Cross-Platform Creators covers the balance math. On model 2026-08-18.1 that row is the 18% platform strength weight, shared across the creator's cards.
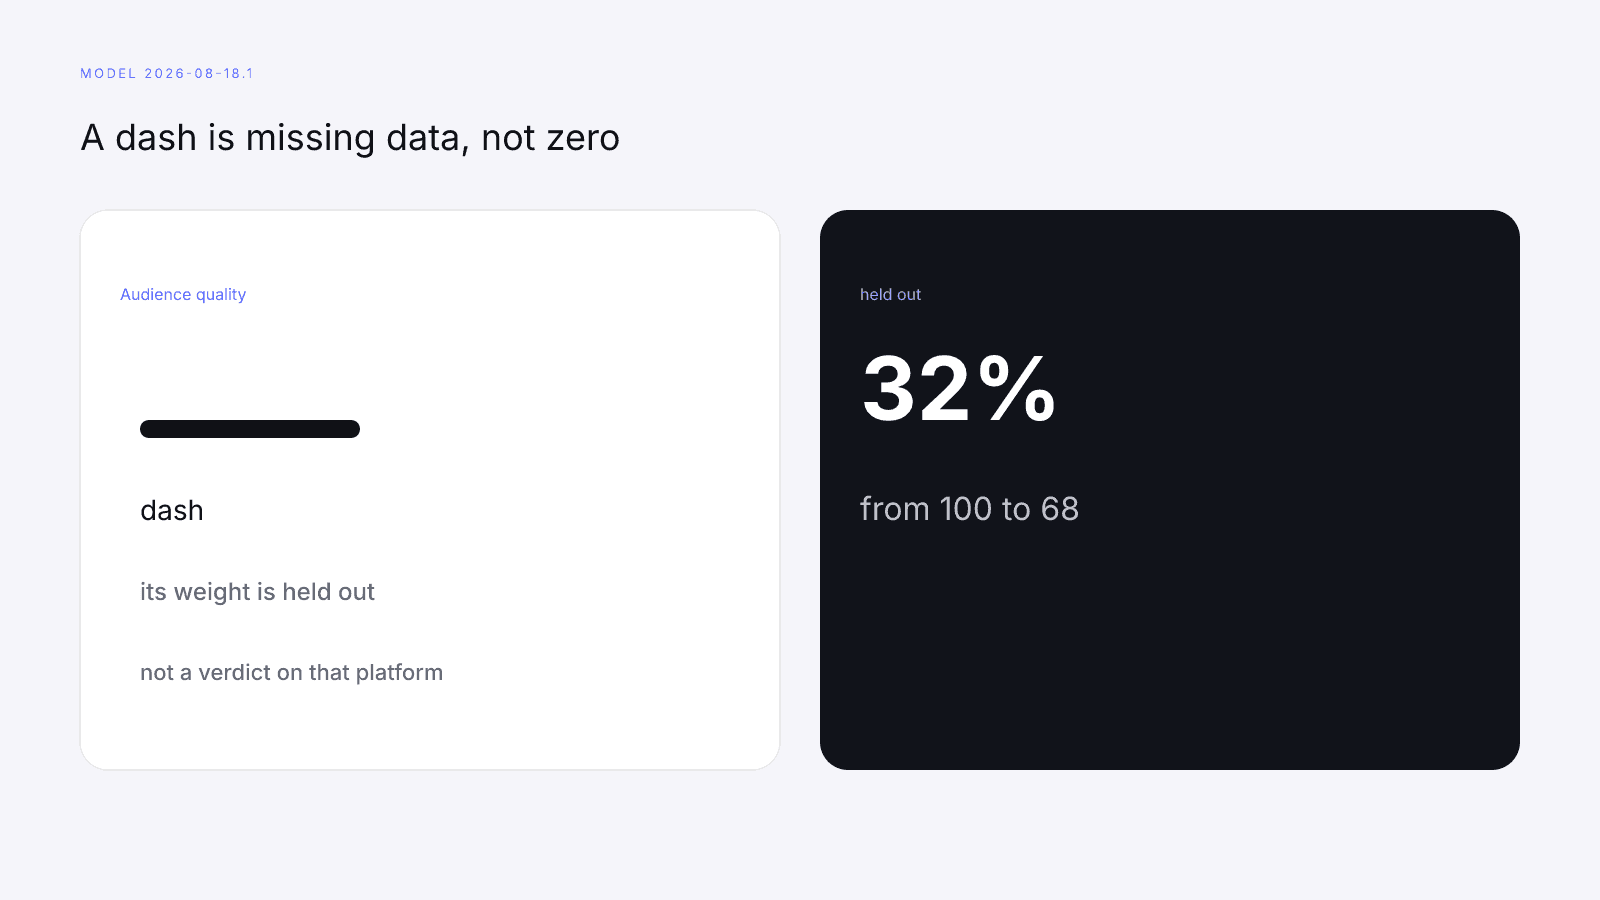
A dash is missing data, not zero, and its weight is held out. On model 2026-08-18.1 a dashed audience quality row holds out the 32% weight, so coverage falls from 100 to 68. The composite is then taken over the rows that remain. A dash on one platform's card is not a verdict on that platform. The other cards can still show a number on the same row. Missing Data on Creator Metrics is the full rule. Do not type a zero, and do not borrow the number from a different app.
A requested platform with no followers and no engagement returns not found, not a low score. Not found means the app you asked about returned no public profile, or one with neither a public audience nor a public engagement rate. There is no composite to compare with the other cards.
Example (fictional creator). This creator has 600,000 Instagram followers and 400,000 TikTok followers, no YouTube, and no 12-month growth figure. The follower total is 1,000,000, so reach & momentum is 60 on both cards. Two observed audiences in a 60/40 split give platform strength of 70 plus a balance bonus of 8, which is 78, on both cards. On model 2026-08-18.1 the Instagram card shows audience quality 80, and engagement 4% maps to 50. The composite is (80×32 + 50×27 + 60×23 + 78×18) ÷ 100 = 66.94, which rounds to 67, with coverage 100. The TikTok card shows audience quality: dash (missing), and engagement 2% maps to 25, with coverage 68, because the missing audience-quality weight is held out. The composite is (25×27 + 60×23 + 78×18) ÷ 68 = 3459 ÷ 68, about 50.9, which rounds to 51.
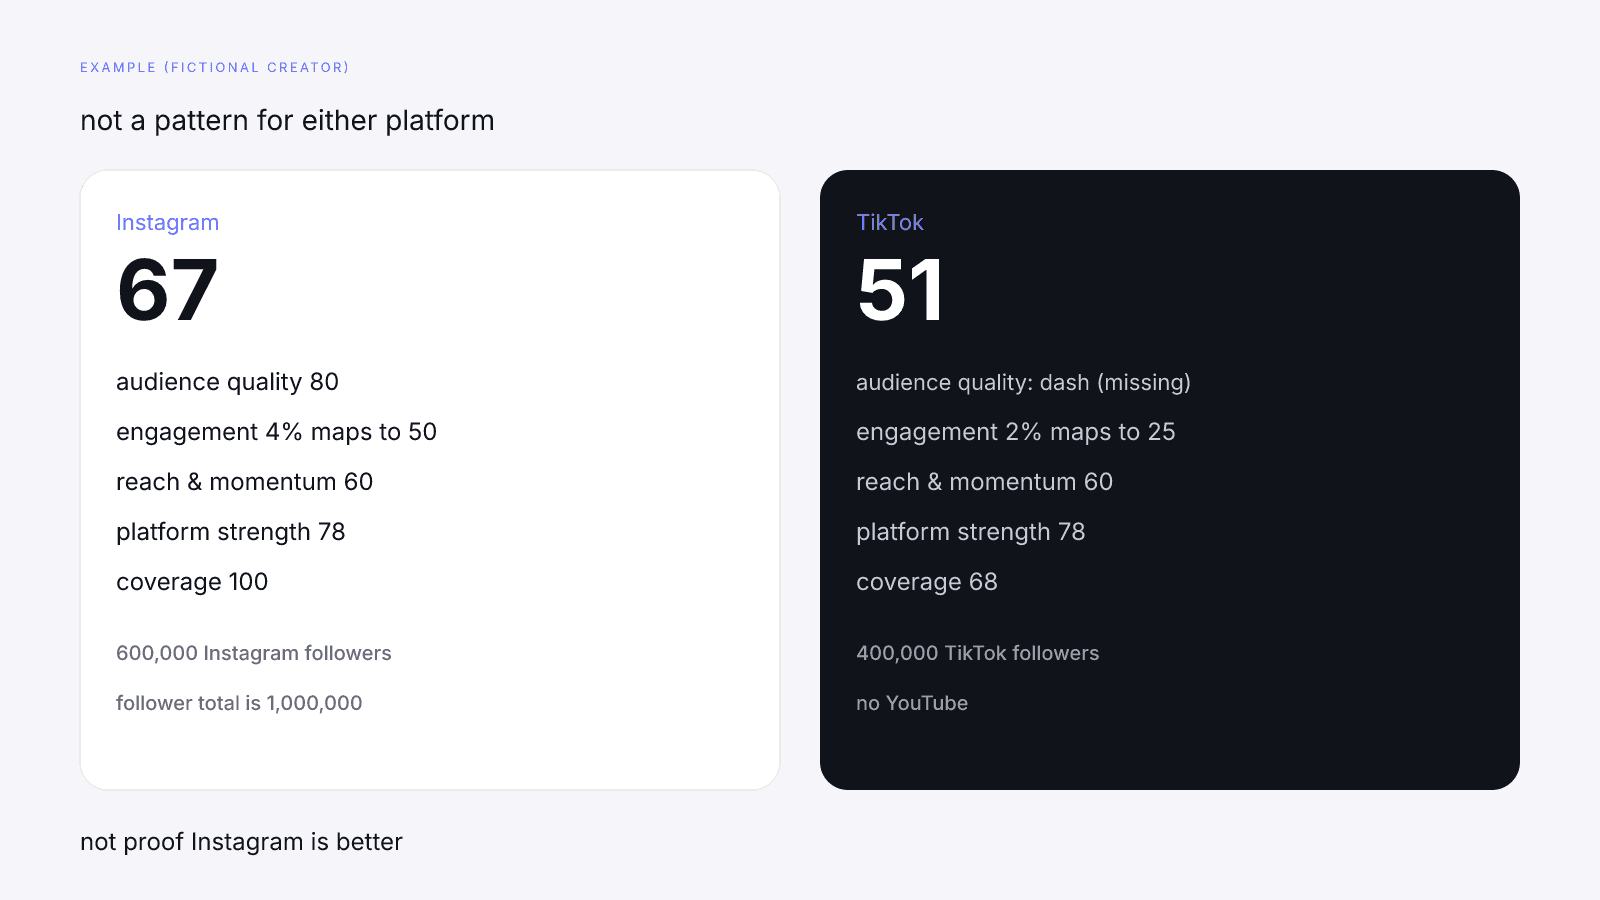
These figures are fictional. They are not a pattern for either platform. A different creator could show the reverse. The 67 and the 51 are two readings of one creator, not proof Instagram is better. Shared rows match: follower total 1,000,000, reach & momentum 60, platform strength 78. Platform rows do not: audience quality is 80 on one card and a dash on the other, and the mapped engagement is 50 on one card and 25 on the other.
If you cite the weights next to this example, keep the model id in the same sentence. On model 2026-08-18.1 the weights are audience quality 32%, engagement strength 27%, reach & momentum 23%, and platform strength 18%. A card stamped with a different model id is a different formula. Do not attach these percentages to a stamp you did not read.
Reading a creator's Instagram, TikTok, and YouTube cards
Read one card at a time, for the app in the deliverables. Instagram InfScore Factors is the factor-by-factor reading of an Instagram card. TikTok Reach vs Engagement is that reading for a TikTok card. YouTube Momentum Signals is that reading for a YouTube card.
Comparing two creators is a different task from reading two cards for one creator. Comparing Two Creators Fairly With InfScore says to match the model id and the platform before you compare two people. Two readings of one person, on two apps, are not that comparison. Put them side by side only to see which rows are shared and which rows came from the looked-up platform.
When a row is a dash, name it. Missing Data on Creator Metrics shows why a dash stays missing. Do not average it with the same row on another app, and do not treat thinner coverage as a reason the platform is a poor fit. Fit is still the format, the audience sentence, and the deliverables.
What the score can't tell you about a platform
The score cannot tell you which platform fits the campaign: it does not rank Instagram, TikTok, and YouTube, and it does not publish a platform-wide engagement gap, a user count, or a demographic split. A format described above is only what the app hosts.
It is not a percentile, price estimate, or guarantee of campaign results. A 67 on a fictional Instagram card is not a promise that the post will work, and a 51 on a fictional TikTok card is not a warning that the post will fail. Both numbers are readings of public, provider-reported signals under one model. The campaign result is something you measure after the work runs. InfScore does not measure it.
There is no score cutoff on this page. Do not add one in the brief. The fictional 67 and 51 are labelled arithmetic. They are not bars anyone has to clear.
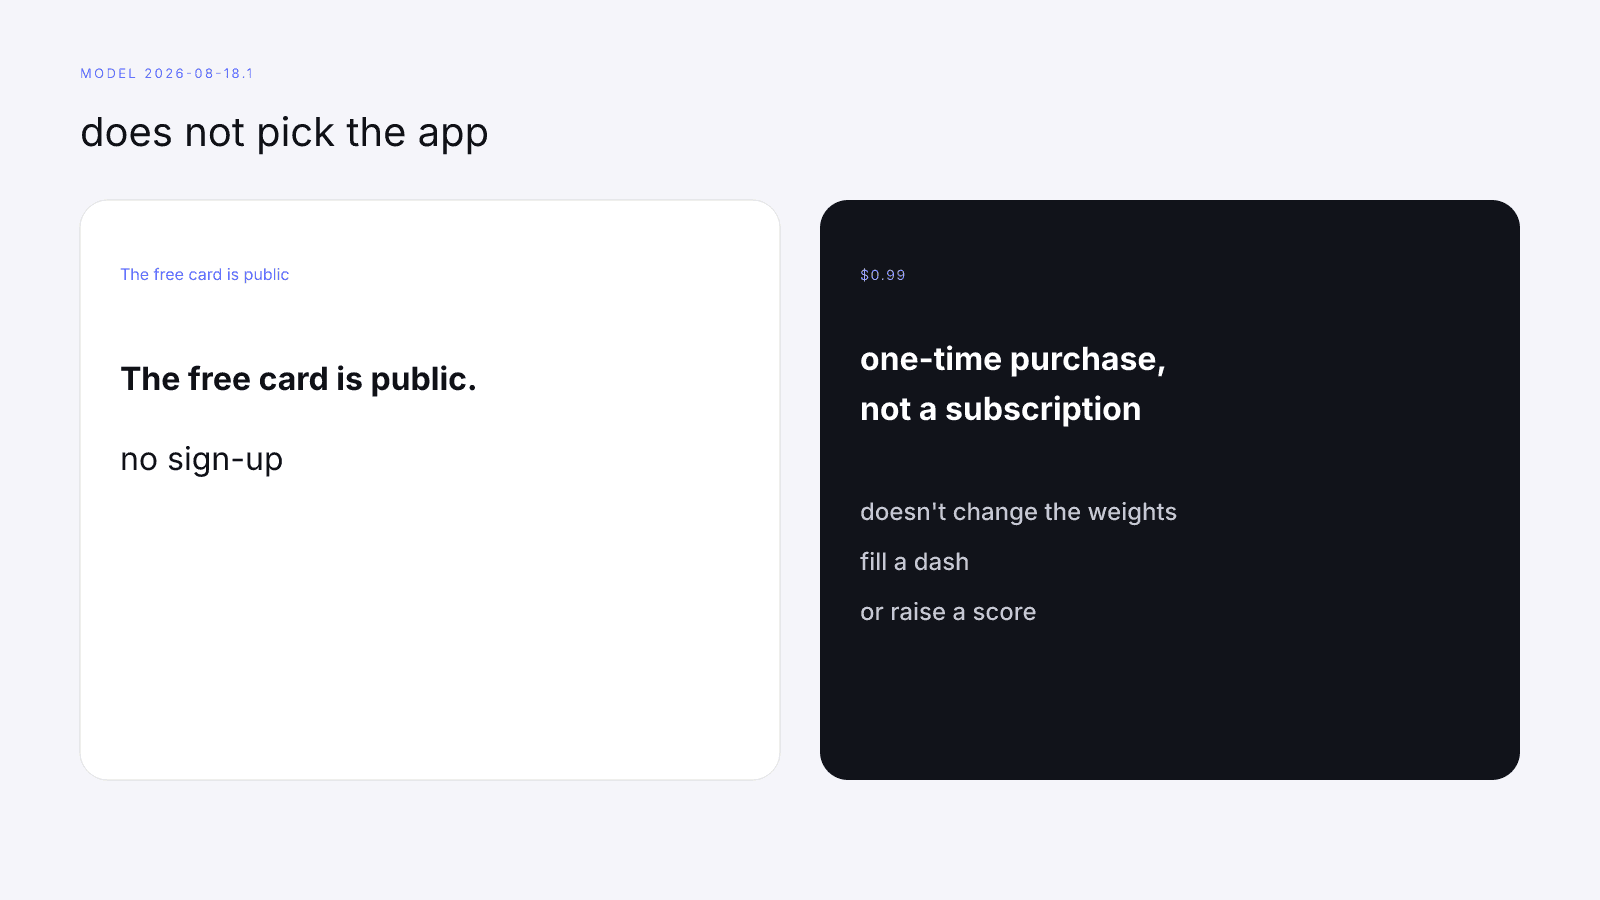
The free card is public. It needs no sign-up. Paying for the denser report does not pick the app either. The $0.99 purchase is the full creator report, with audience, growth, and platform deep dives when they exist. It is a one-time purchase, not a subscription. On model 2026-08-18.1 the weights stay audience quality 32%, engagement strength 27%, reach & momentum 23%, and platform strength 18%. Paying doesn't change the weights, fill a dash, or raise a score. Free InfScore vs the $0.99 Report: What Actually Changes covers what the paid page adds. It does not add a platform recommendation.
If the next step is outreach, InfScore doesn't find creator contacts or send outreach for you. A platform choice is not an introduction. You need a channel of your own before you write to the creator. The card is the public reading for the app in the deliverables. It is not a message and not a list of addresses.
A not-found result is not a verdict on the other apps. It means the app you requested returned no public profile, or one with no followers and no engagement rate. Open a card for an app the creator does use, or accept that this creator has no public reading on the app the format needs. Do not turn not found into a zero and compare that zero with a composite.
A platform-fit worksheet you can copy
Use the worksheet as a checklist for one campaign. The right-hand column says who is allowed to answer. The brand answers the job. The creator answers what they will make and who they say watches. The card answers only what it shows for the platform you looked up.
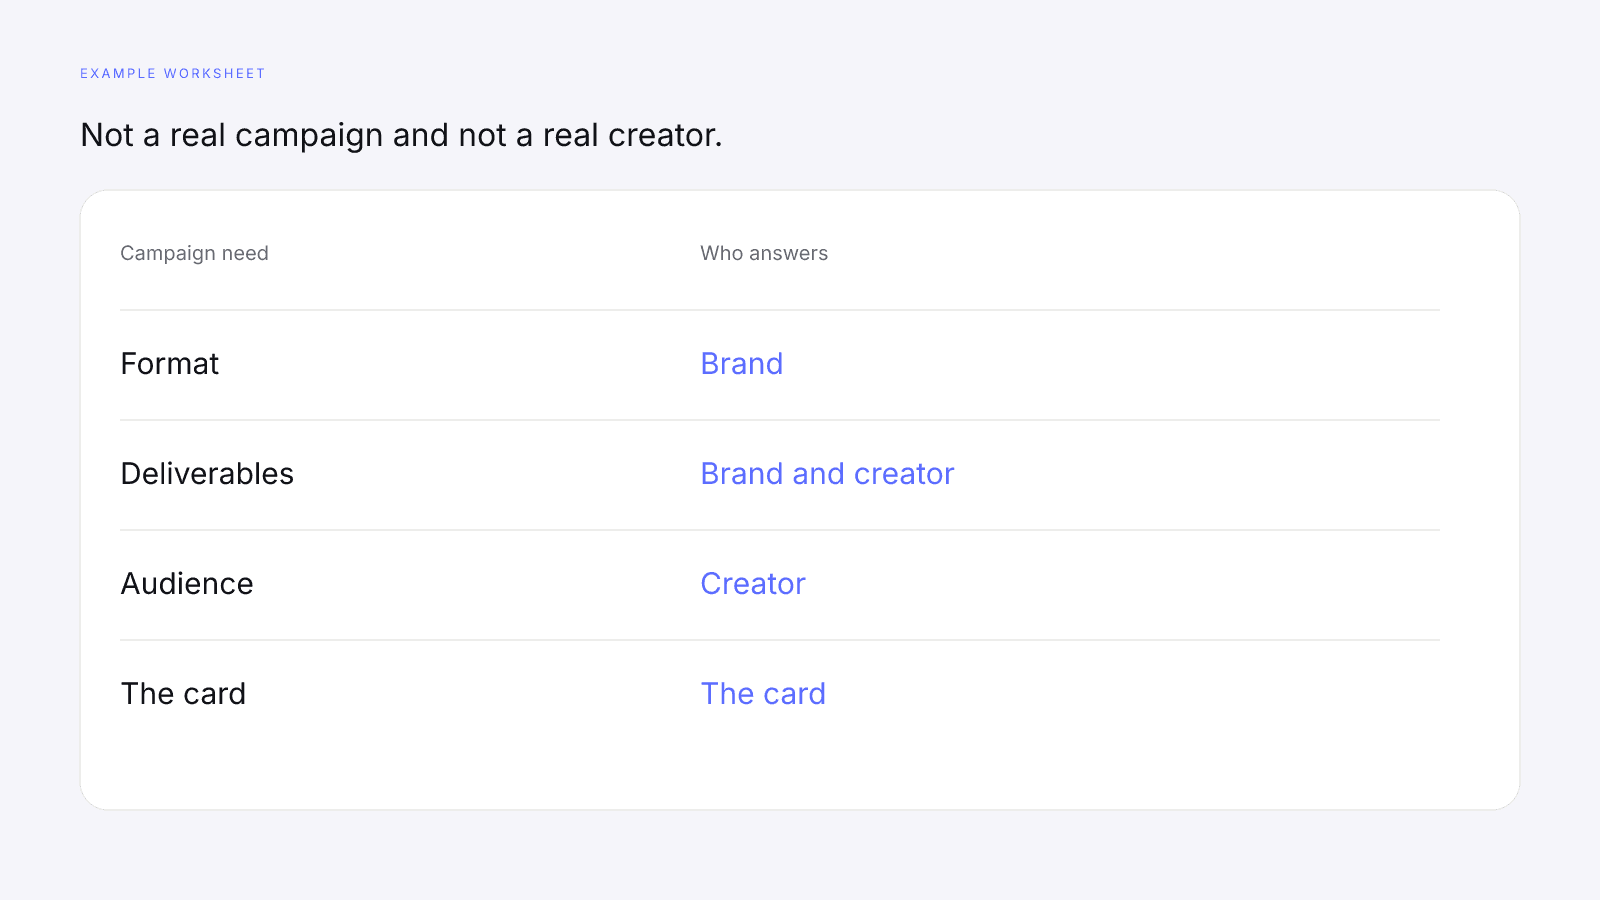
Example worksheet. Not a real campaign and not a real creator.
| Campaign need | Question | Who answers |
|---|---|---|
| Format | Which placement does the piece need: photo, carousel, Stories, short vertical video, or longer video? | Brand |
| Deliverables | What will be posted, how many pieces, and on which app? | Brand and creator |
| Audience | Who does the creator say watches, in their own words? | Creator |
| Card | What does the public card show for the platform you looked up, including any dash? | The card |
| Model | Which model id is on the card? If you cite weights, are they the ones for model 2026-08-18.1? | The card |
| Shared rows | Do follower total and platform strength match on the other cards you opened for this creator? | The card |
| Platform rows | Do audience quality, engagement, and growth on this card come from the platform you looked up? | The card |
| Missing data | If a row is a dash, did you leave it missing, since a dash is missing data, not zero? | Brand, reading the card |
| Brief | Where will the agreed deliverables be written down? | Brand and creator |
The brief row points at a document, not at a score. What to Put in an Influencer Brief (With a Template) is where the agreed deliverables, the public URL, the model id, and any dash get written down. Copy the card. Do not turn the composite into a reason the brief can go out.
If a teammate wants a "platform score" column, leave it off. The 67 and the 51 in the fictional example are not a column you paste onto a real name. A homemade grade brings back a cutoff this worksheet does not have. An empty deliverables cell is a question for the creator. A dash filled with a zero is a mistake.
After the worksheet, search the app the deliverables named, read the rows that came back, and name every dash. The number is a reading you can cite with its model id.
Look the creator up on the platform you chose. The free card is public and needs no sign-up. Search from infscore.com.
If you need the deep dives for one creator, the full report is a one-time $0.99, and it does not choose the platform. See Pricing.
FAQ
Is Instagram or TikTok better for influencer marketing?
Neither by default. The campaign picks the platform from the format you need, the audience the creator describes, and the deliverables you agree. InfScore does not pick a network and does not rank Instagram, TikTok, or YouTube against each other. After you choose, look the creator up on that platform and read that card.
Does InfScore use a different formula for Instagram, TikTok, and YouTube?
No. One formula runs on all three. On model 2026-08-18.1 the weights are audience quality 32%, engagement strength 27%, reach & momentum 23%, and platform strength 18%. Audience quality, engagement, and growth come from the platform you looked up. The follower total and platform strength count observed public audiences across Instagram, TikTok, and YouTube.
Why does the same creator show different scores on Instagram and TikTok?
The shared rows usually match and the platform rows can differ. Follower total and platform strength are shared across the Instagram, TikTok, and YouTube cards. Audience quality, engagement, and growth are taken from the platform you looked up, so a dash or a different provider-reported rate changes that card's composite. Example (fictional creator): the Instagram reading on this page is 67 and the TikTok reading is 51. Those are two readings, not proof that one network is stronger, and a different creator could show the reverse.
Can I compare a TikTok InfScore with an Instagram InfScore?
You can read both cards as two readings of one creator on one formula. Check that both cards show the same model id before you treat the numbers as comparable. Comparing two different creators is a separate job: use the same model id and look both of them up on the same platform. A higher composite on one platform's card is not a ranking of the networks.
Does being on all three platforms raise a creator's score?
Through two rows, and only when the audience is observed. On model 2026-08-18.1 platform strength is 18% of the composite, and it counts observed public audiences only. The floors are 45/70/90: 45 for one observed audience, 70 for two, and 90 for three, plus a small balance bonus when the counts are not lopsided. The new audience's followers also join the follower total behind reach & momentum, which is a log scale, so the addition is compressed. Empty profiles do not count. Audience quality, engagement, and growth come from the platform you looked up, so another app does not move them.
What does a dash on one platform's card mean?
A dash is missing data, not zero, and its weight is held out. Coverage drops because that weight is left out of the composite. A dash on one platform's card is not a verdict on that platform, and it is not a number you should invent. Another platform's card for the same creator can still show a value on the same row.
Does the $0.99 report tell me which platform to use?
No. The $0.99 purchase is the full creator report, with audience, growth, and platform deep dives when they exist. It is a one-time purchase, not a subscription. Paying doesn't change the weights, fill a dash, or raise a score. The report does not tell you whether to use Instagram, TikTok, or YouTube.