Comparing Two Creators Fairly With InfScore
Before you rank two creators by InfScore, match the model id and platform, then check coverage and dashes. Compare the headline number last.
This versioned composite uses only available public signals. Missing factors stay unavailable and their weight is rebalanced across observed factors. It is not a percentile, price estimate, or guarantee of campaign results. Model 2026-08-18.1.
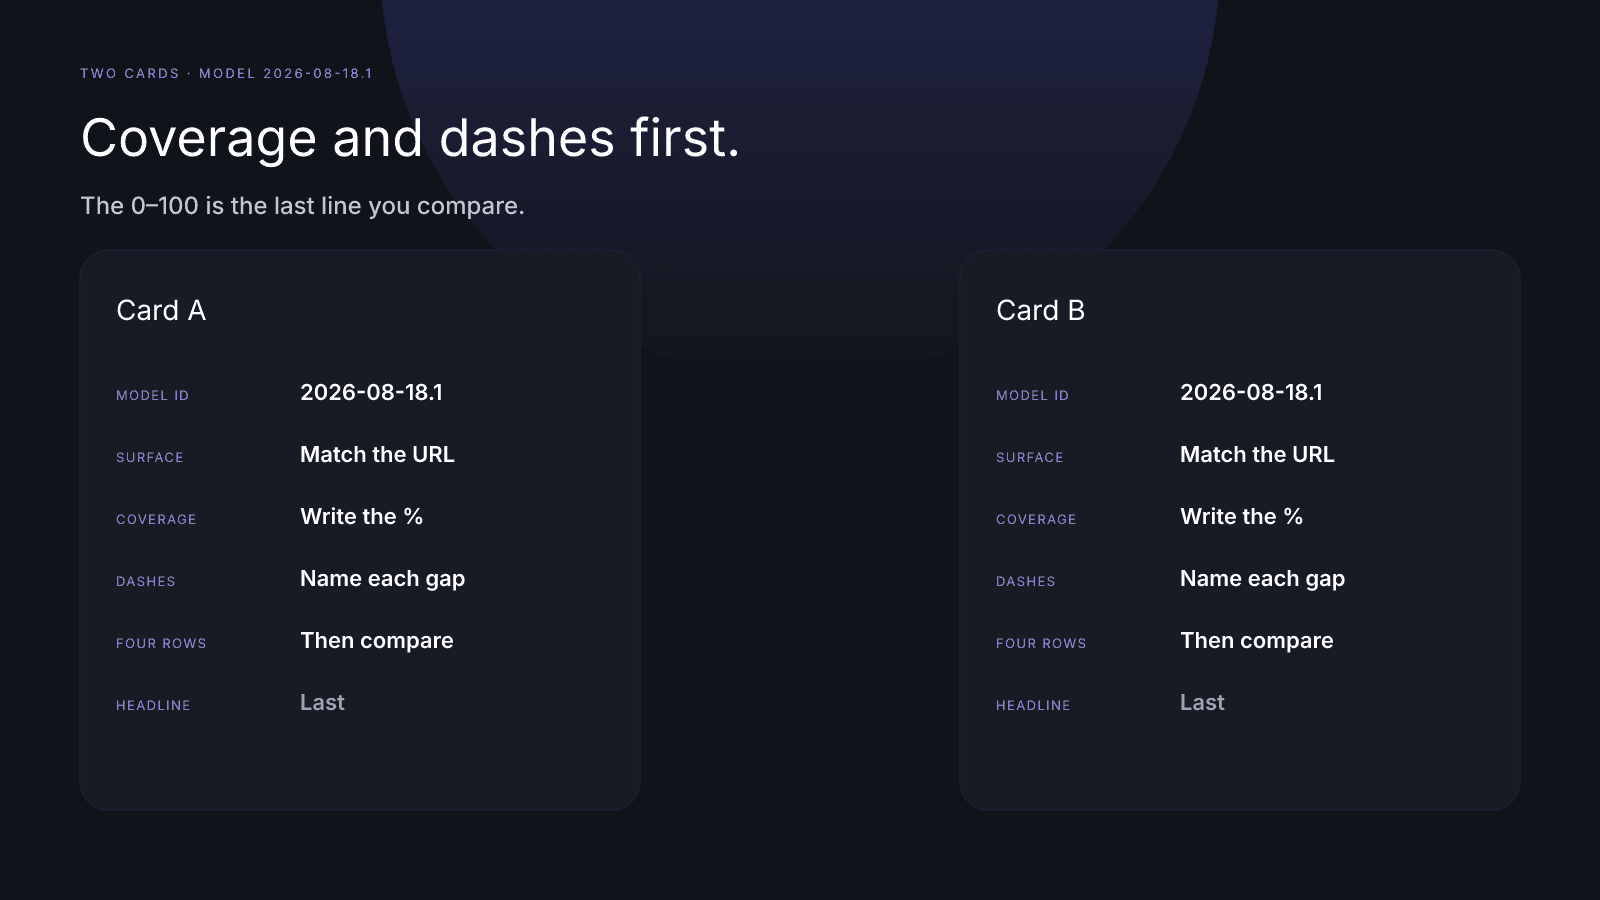
When you compare two creators' InfScore cards, match the evidence before you rank the number. Open two public scorecards. Both need the same model id, and the same platform surface when the decision is a ranking. Write down scoring coverage and every dash. Read audience quality, engagement, reach & momentum, and platform strength side by side. Compare the 0–100 last. On model 2026-08-18.1 the mix is audience quality 32%, engagement 27%, reach & momentum 23%, and platform strength 18%. Instagram, TikTok, and YouTube are lookup surfaces of that one composite, not three formulas. The public score page shows one card. You open two URLs. A higher headline is not a booking order.
Why two headlines are not a comparison
A pair of 0–100 figures is the last line of two separate readings. The shortcut is to compare two influencers by those headlines and stop. That shortcut skips the evidence that produced each number. The composite is the weighted average of the factor rows that exist, divided by scoring coverage. If one card used all four weights and the other held a weight out, the two headlines do not share a denominator. The gap can look decisive. It is still two different kinds of average.
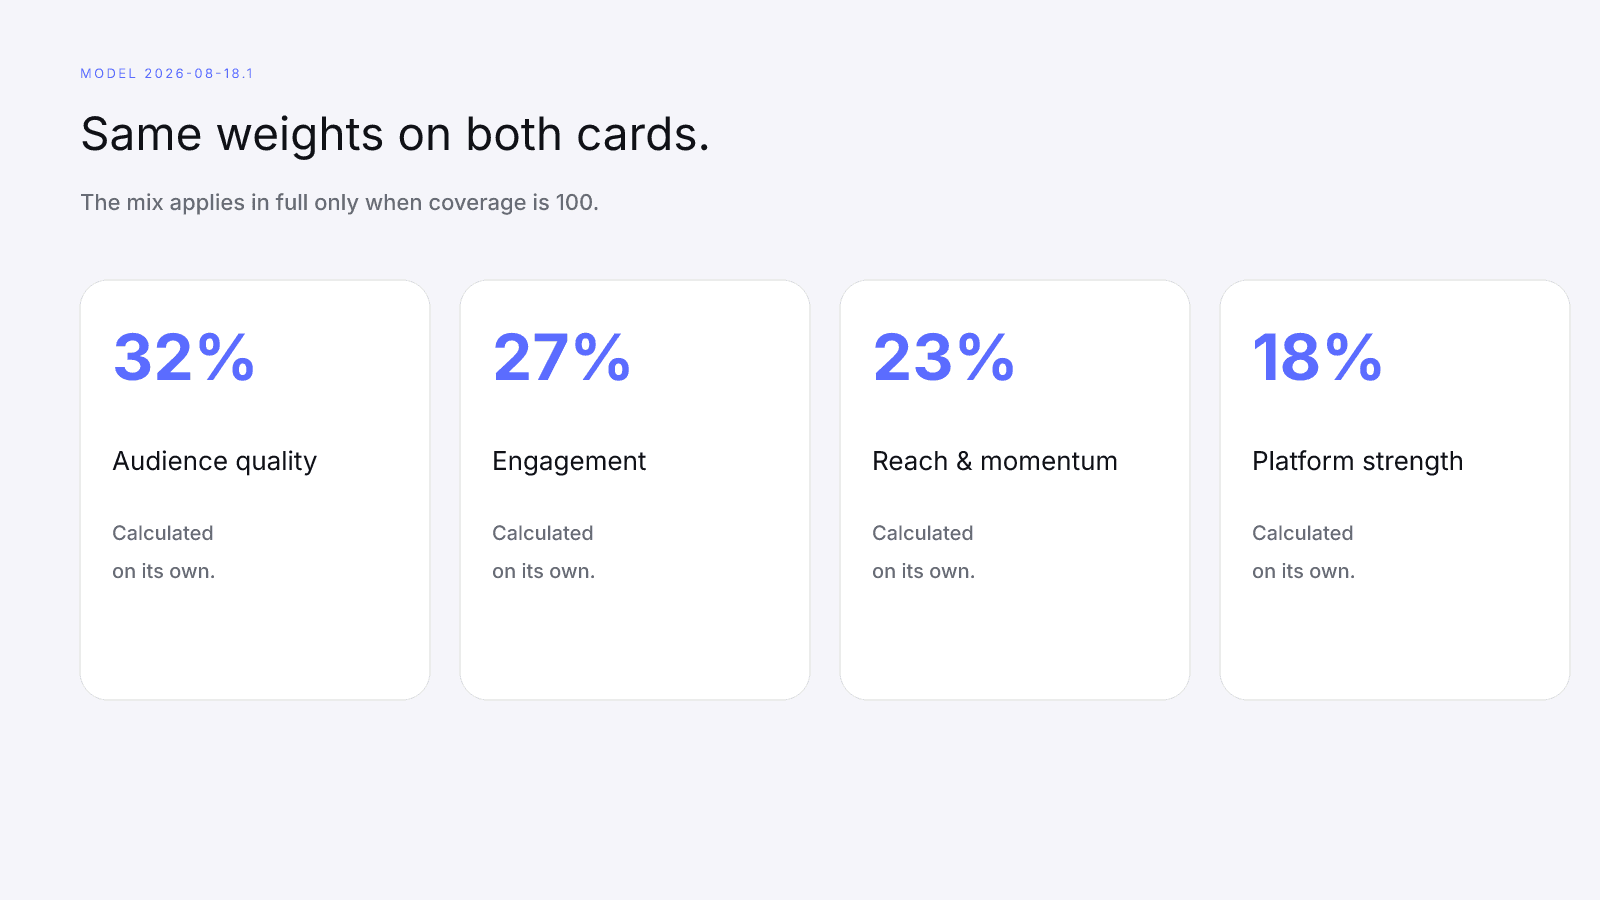
The published weights on model 2026-08-18.1 are fixed when every factor is present:
- Audience quality, 32%. Provider-measured audience credibility when that public signal exists. Otherwise a dash. The split between size and credibility is Audience Quality vs Follower Count.
- Engagement, 27%. A public engagement rate mapped onto a fixed 0–8% scale, capped at 100. A 4% rate maps to 50. Values above 8% stay at 100. The scale is What a Good Engagement Rate Looks Like in 2026.
- Reach & momentum, 23%. Logarithmic public audience size, blended 70/30 with growth when a growth signal exists. No growth signal means the row is the log reach alone.
- Platform strength, 18%. How many public audiences were observed. On this model the floors are 45 for one, 70 for two, and 90 for three or more, plus a small balance bonus when follower counts are not concentrated on a single network. Empty profiles do not get those floors.
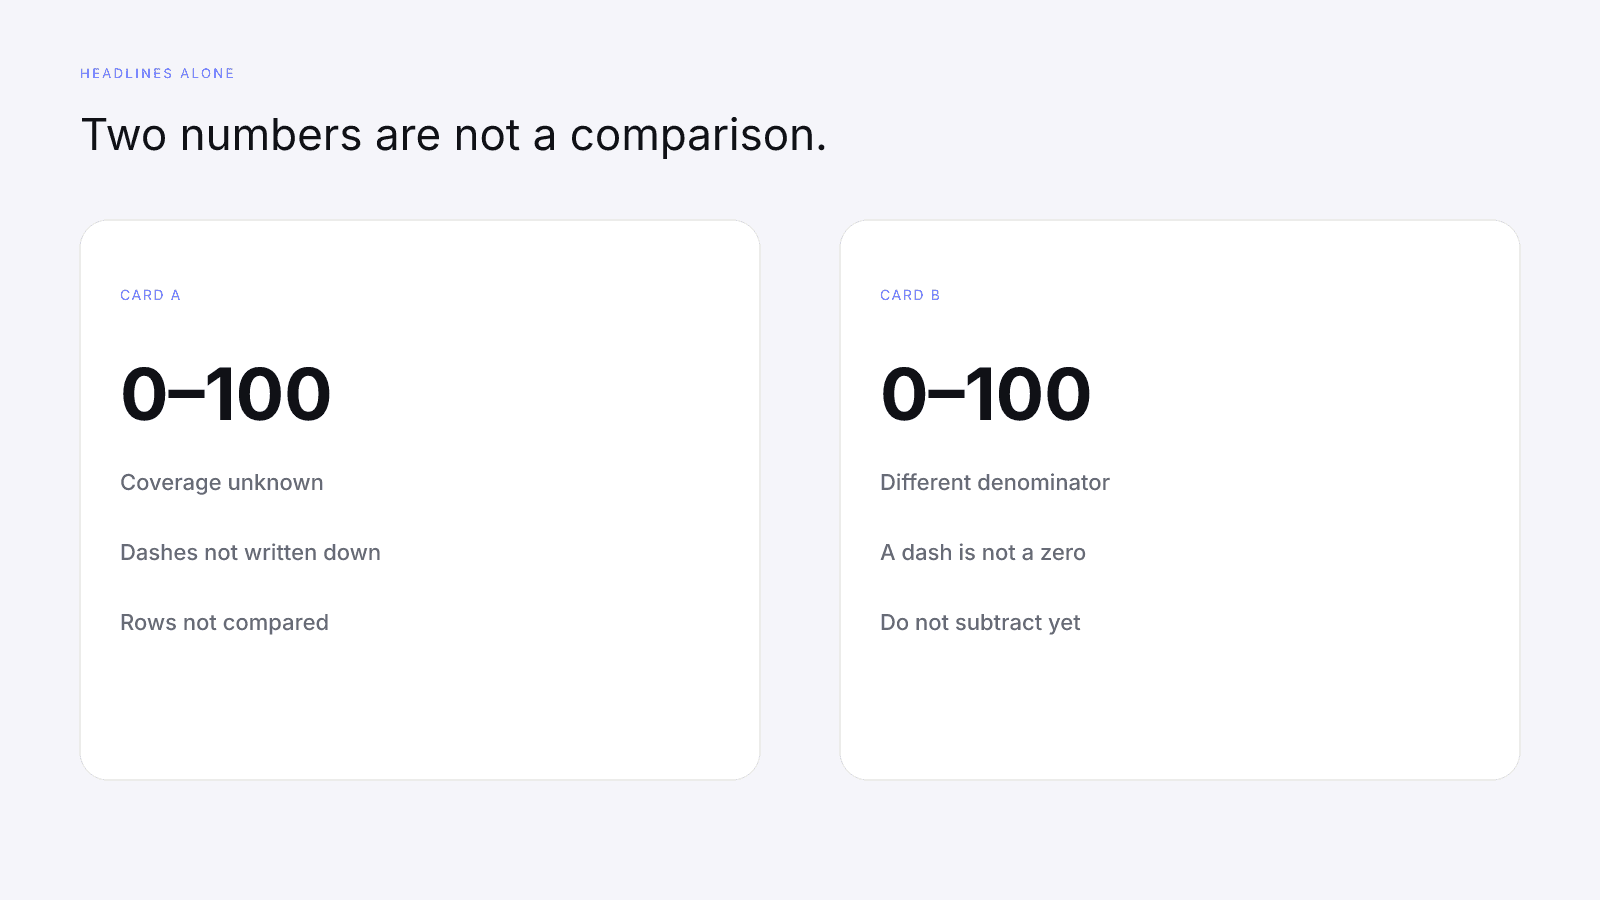
Those four factors are calculated independently. A strong reach row cannot lend points to a missing audience-quality row. The methodology states that in one line: available factor weights are normalized when provider data is missing. The full tour of the mix is How to Measure Influencer Performance.
A separate case from the model tests, not from two live creators and not from a campaign, uses round numbers. Audience quality is missing, engagement sits at a 4% public rate (50 on the factor), reach & momentum is 40, and platform strength is 45. Coverage is 68. The composite is (50 × 27 + 40 × 23 + 45 × 18) ÷ 68, which is 3080 ÷ 68, which rounds to 45. The engagement factor of 50 is not the InfScore. The 45 is the rebalance rule on this stamp. That figure is a model test, not a creator you can book or one half of a matchup.
The tier beside the headline is shorthand for that same number. Elite is 90–100, Rising is 80–89, Emerging is 65–79, and Developing is below 65. Crossing a band means the rebalanced mix on that one card crossed a line. InfScore does not publish a leaderboard of handles or declare a winner between two profiles.
Match the model id and the platform surface
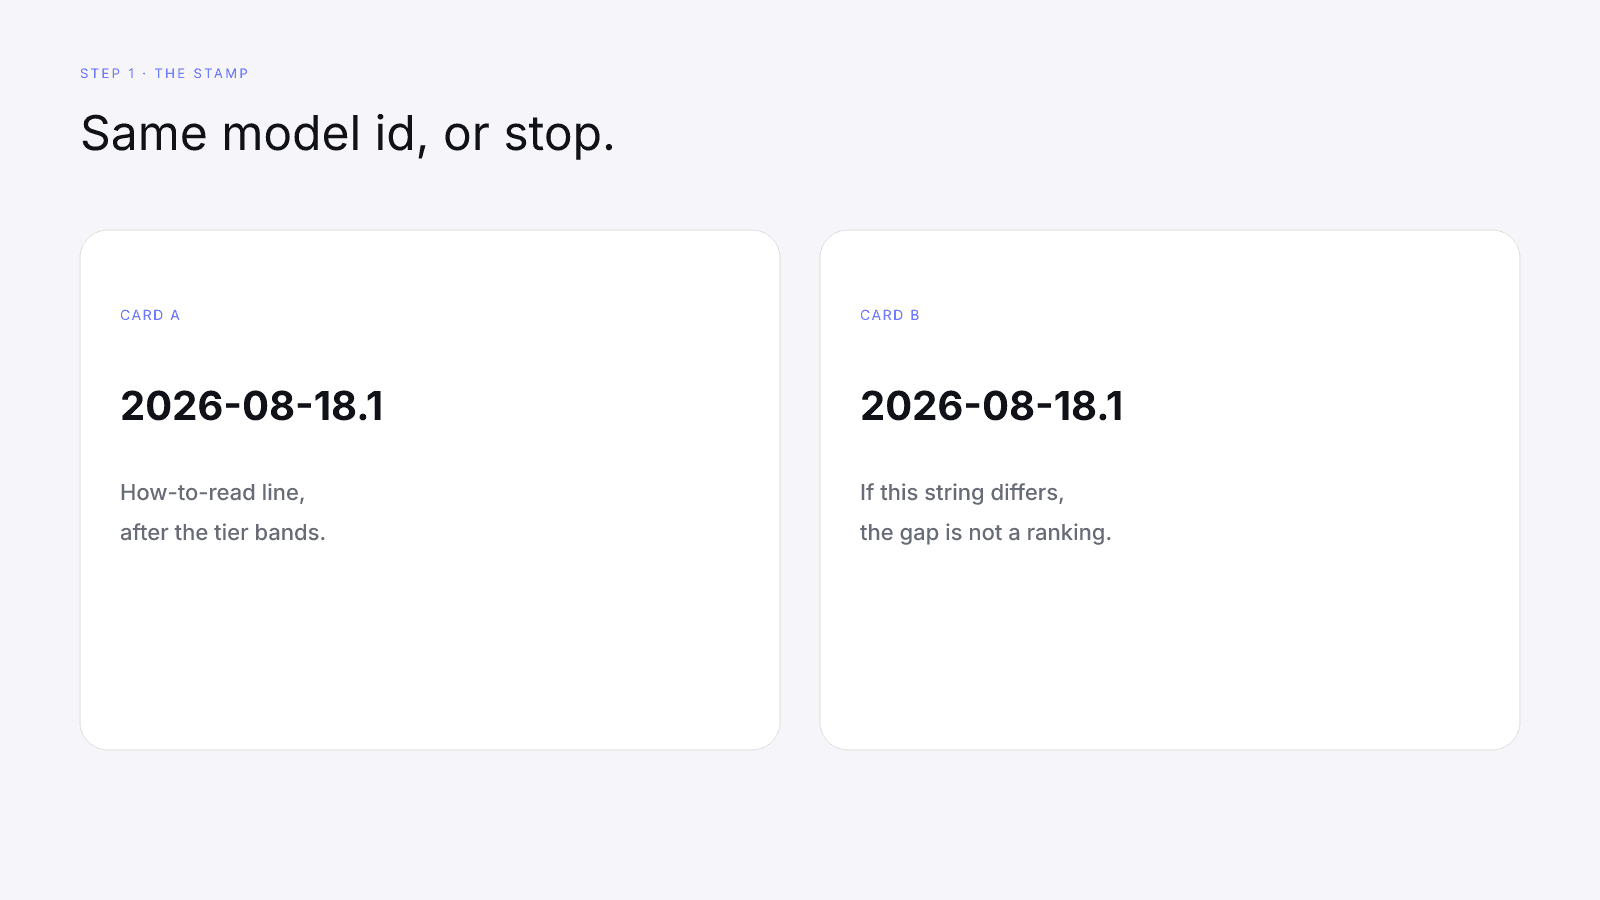
Start with the stamp. On the public scorecard the model id sits in the how-to-read line, after the tier bands. Cards opened on 2026-10-05 print Model 2026-08-18.1. That string is the version of one composite. It is not a leaderboard season. The date inside the id is not a scoring month. If the two cards print different ids, stop. The gap between the headlines mixes two stamps. Comparing InfScore Across Model Versions is that problem. This guide assumes the ids already match. Cite the id printed on the card in front of you. There is no menu of older stamps beside it.
Then match the surface. The platform on the score URL is the lookup. Instagram, TikTok, and YouTube are lookup surfaces of the same InfScore. One formula, one version line. Changing the platform query does not change the weights or the model id. It changes which public profile you asked for, and it can change which signals came back. A comparison across surfaces is allowed only with that caveat. Do not call one creator better because an Instagram card printed a higher 0–100 than a TikTok card, or the reverse.
Instagram InfScore Factors, TikTok Reach vs Engagement, and YouTube Momentum Signals describe the same four weights facing different public inputs. Cross-Platform Creators is the platform-strength piece, including why an empty second profile does not raise the floors. None of those pages is a second formula, and none of them ranks one surface above another.
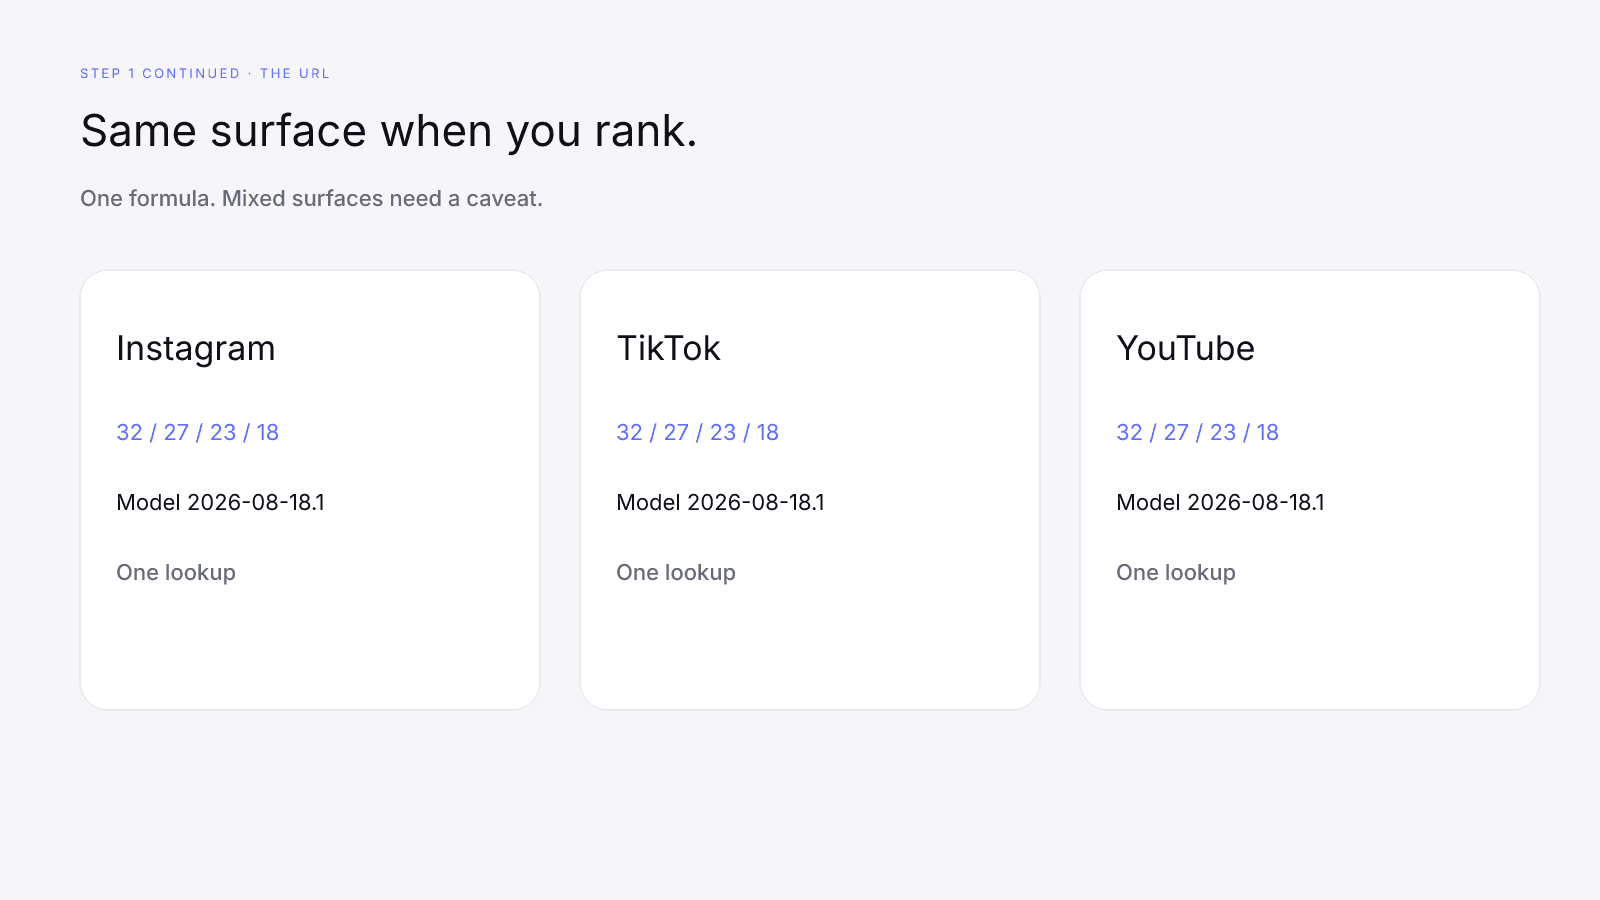
The public score page will not do this matching for you. Open one handle, read the stamp and the platform in the URL, then open the second handle in another tab. Nothing on that page loads a second creator beside the first. There is no side-by-side control on the score URL. Your notes are the comparison. If you cannot write down both model ids and both surfaces, you do not have a comparison yet. You have two screenshots of a headline.
Check coverage and dashes before you rank
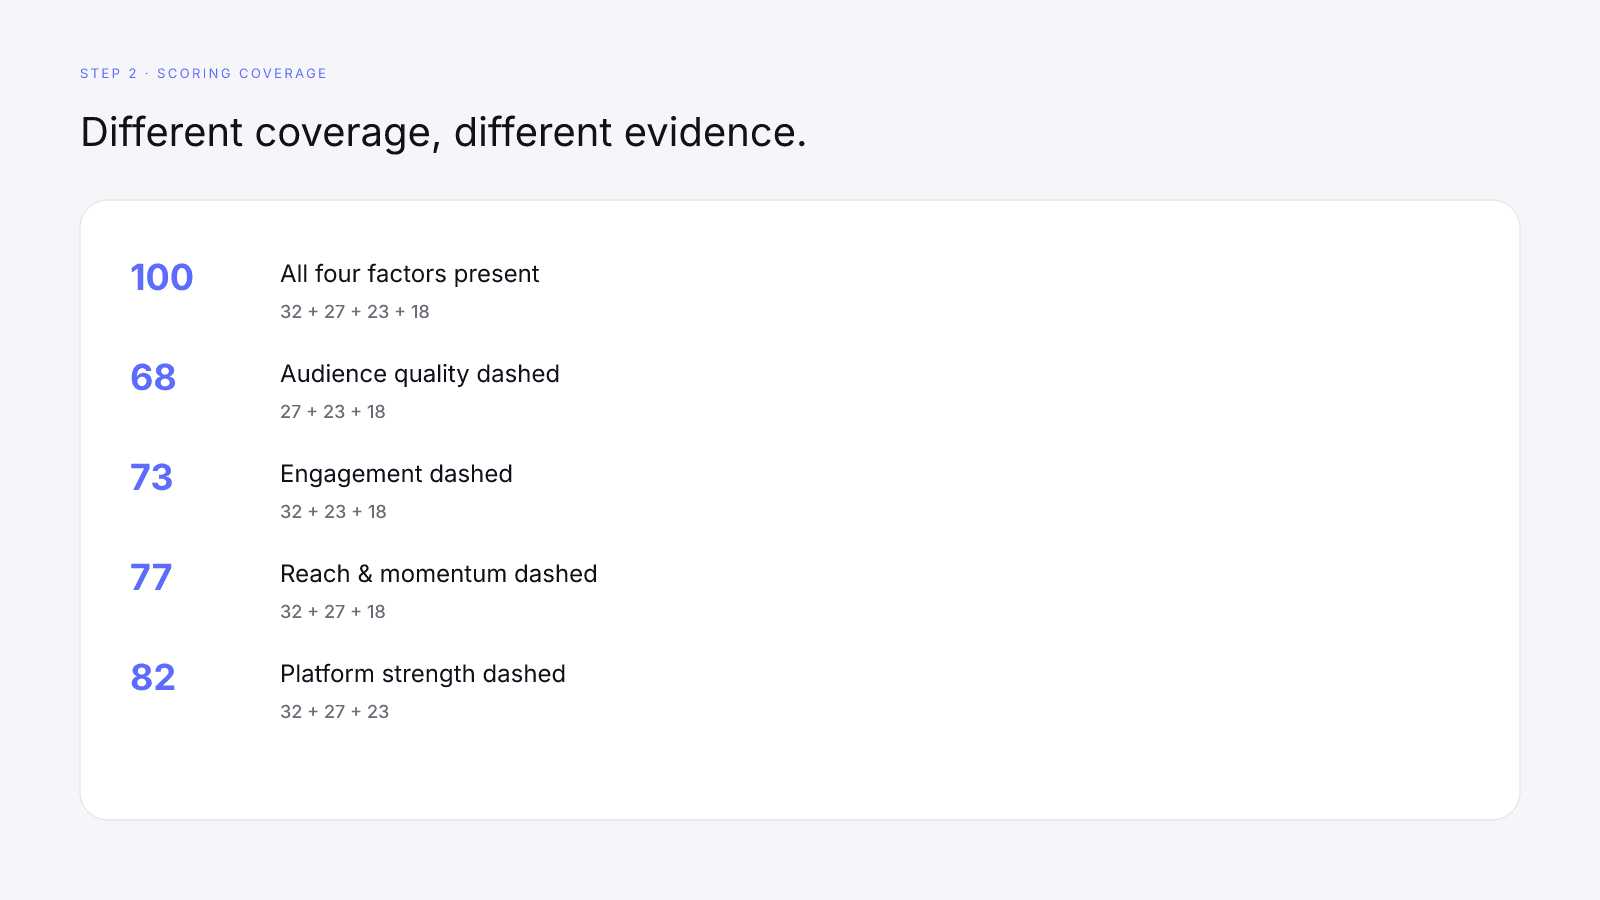
Scoring coverage is the sum of the weights for factors that came back. Full coverage is 100, and the 32/27/23/18 mix applies in full. One missing factor changes the denominator:
- Audience quality dashed: coverage 68 (27+23+18).
- Engagement dashed: coverage 73 (32+23+18).
- Reach & momentum dashed: coverage 77 (32+27+18).
- Platform strength dashed: coverage 82 (32+27+23).
A dash is a gap, not a zero and not a silent pass. The missing weight is held out. The observed weights are rebalanced in their published proportions. Two creators with different coverage are not on the same evidence base. Say that in the note before you mention either headline. Missing Data on Creator Metrics is that arithmetic. The worked case above is the same rule: coverage 68, composite 45, and the missing audience-quality weight never entered the average as a zero.
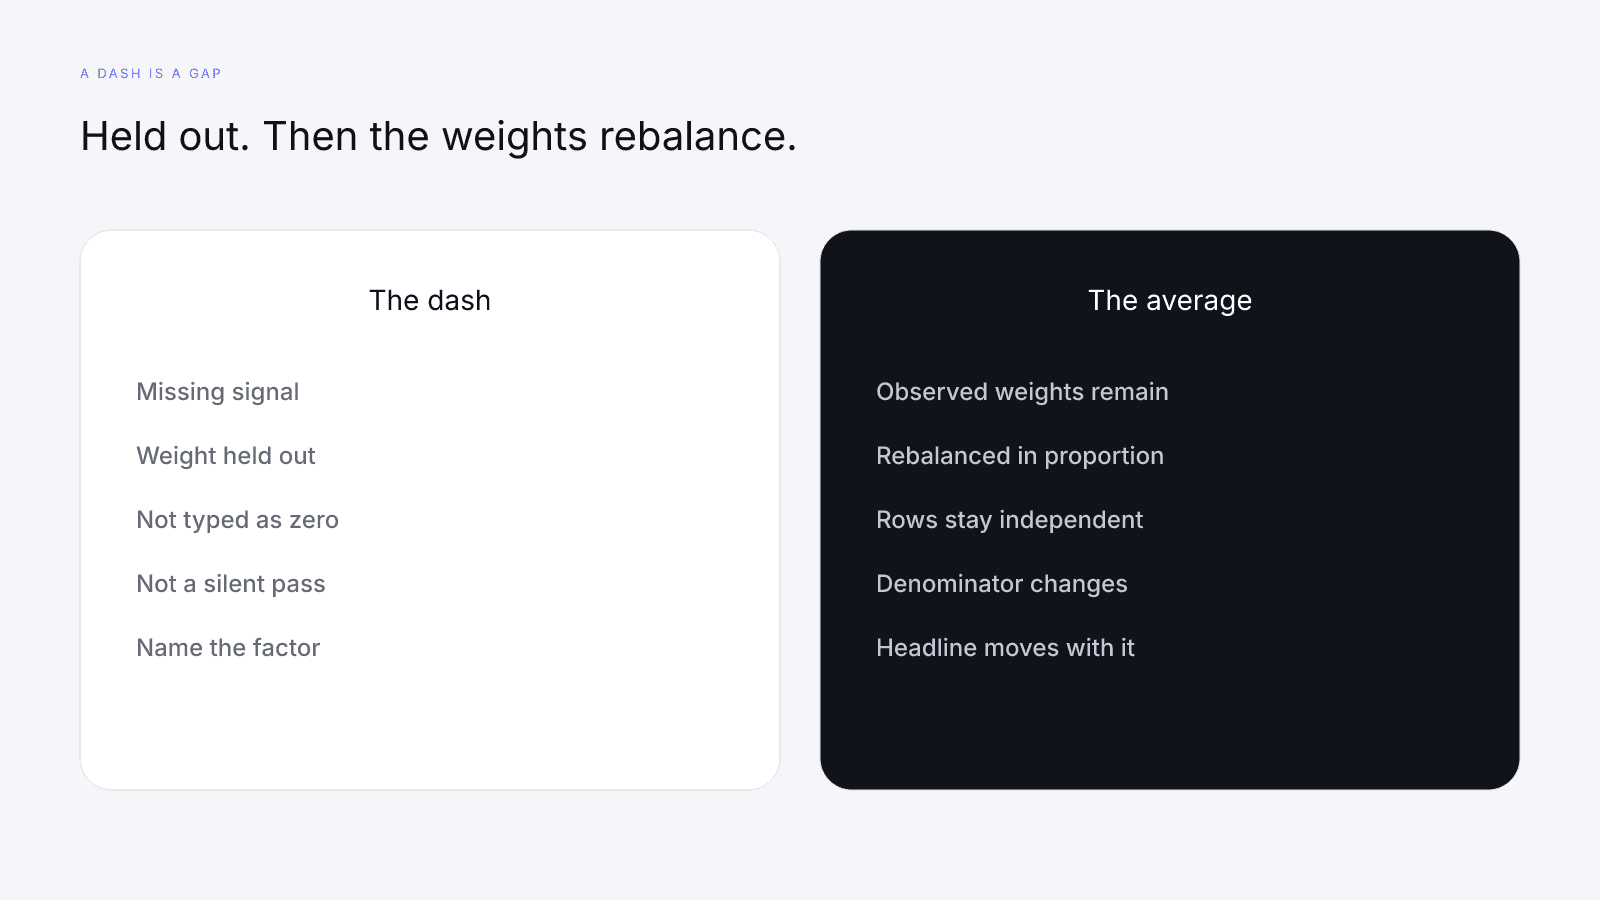
Name the missing factor. "Coverage 68" is incomplete until you know which row is the dash. Audience quality missing and a different factor missing are both partial cards. They are not the same partial card. A note that treats every dash as the same kind of hole will line a credibility gap up against a rate gap and treat the headlines as comparable.
The rows stay independent while that happens. Neither the engagement factor nor the reach row absorbs the missing 32%. Typing a zero into the empty cell and averaging all four weights invents a penalty the model does not apply. Ignoring coverage and subtracting headlines ranks two denominators.
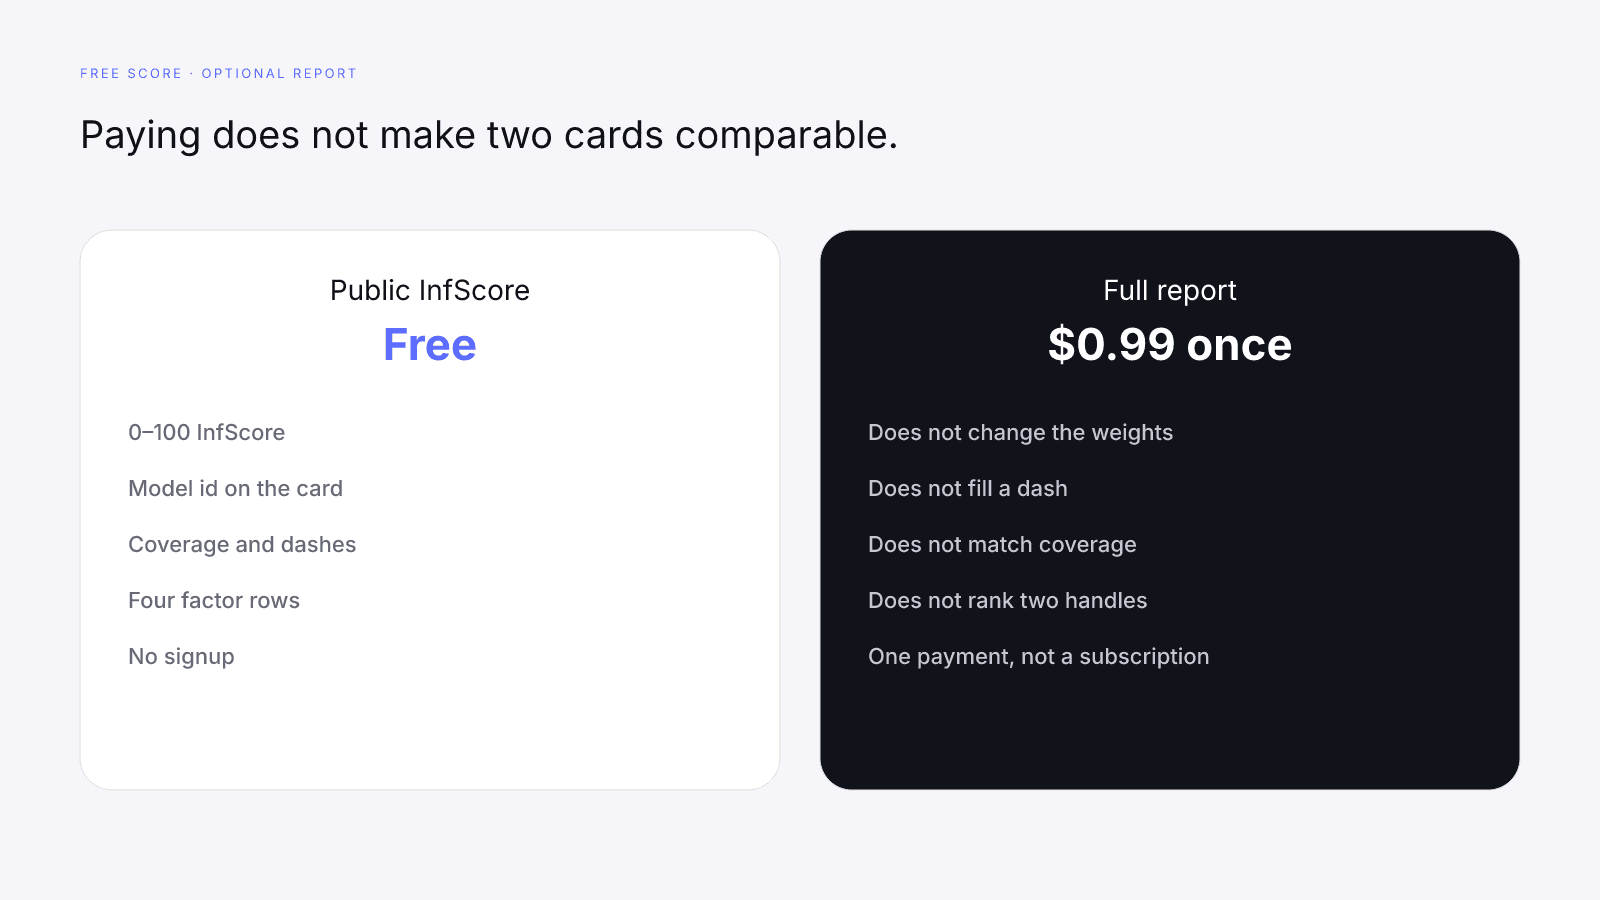
Paying does not close that gap. The free InfScore already shows the dash. The $0.99 report does not fill a dash or rewrite coverage so the two cards share a denominator.
Read the four factor rows side by side
After the stamp, the surface, the coverage, and the dashes, read the rows in published order. Compare a row only to the same row on the other card.
Audience quality is the credibility signal when it exists. Follower count is not this row. If one card shows a number and the other shows a dash, you have one measurement and one gap. Leave the gap as a dash.
Engagement is the public rate on the 0–8% scale. The factor score is not the InfScore. At full coverage it carries 27% of the composite. On a partial card its share of the smaller denominator is larger. A capped 100, from a public rate above 8%, is still one row. It does not replace a missing audience-quality factor.
Reach & momentum scores public audience size on a log scale. When a growth signal exists, growth is 30% of this row and log reach is 70%. A bigger follower total can lift this row. It does not settle the pair. Platform strength starts from the floors of 45, 70, or 90, then a small balance bonus when followers are not piled onto one network. An empty second profile does not count as a second audience.
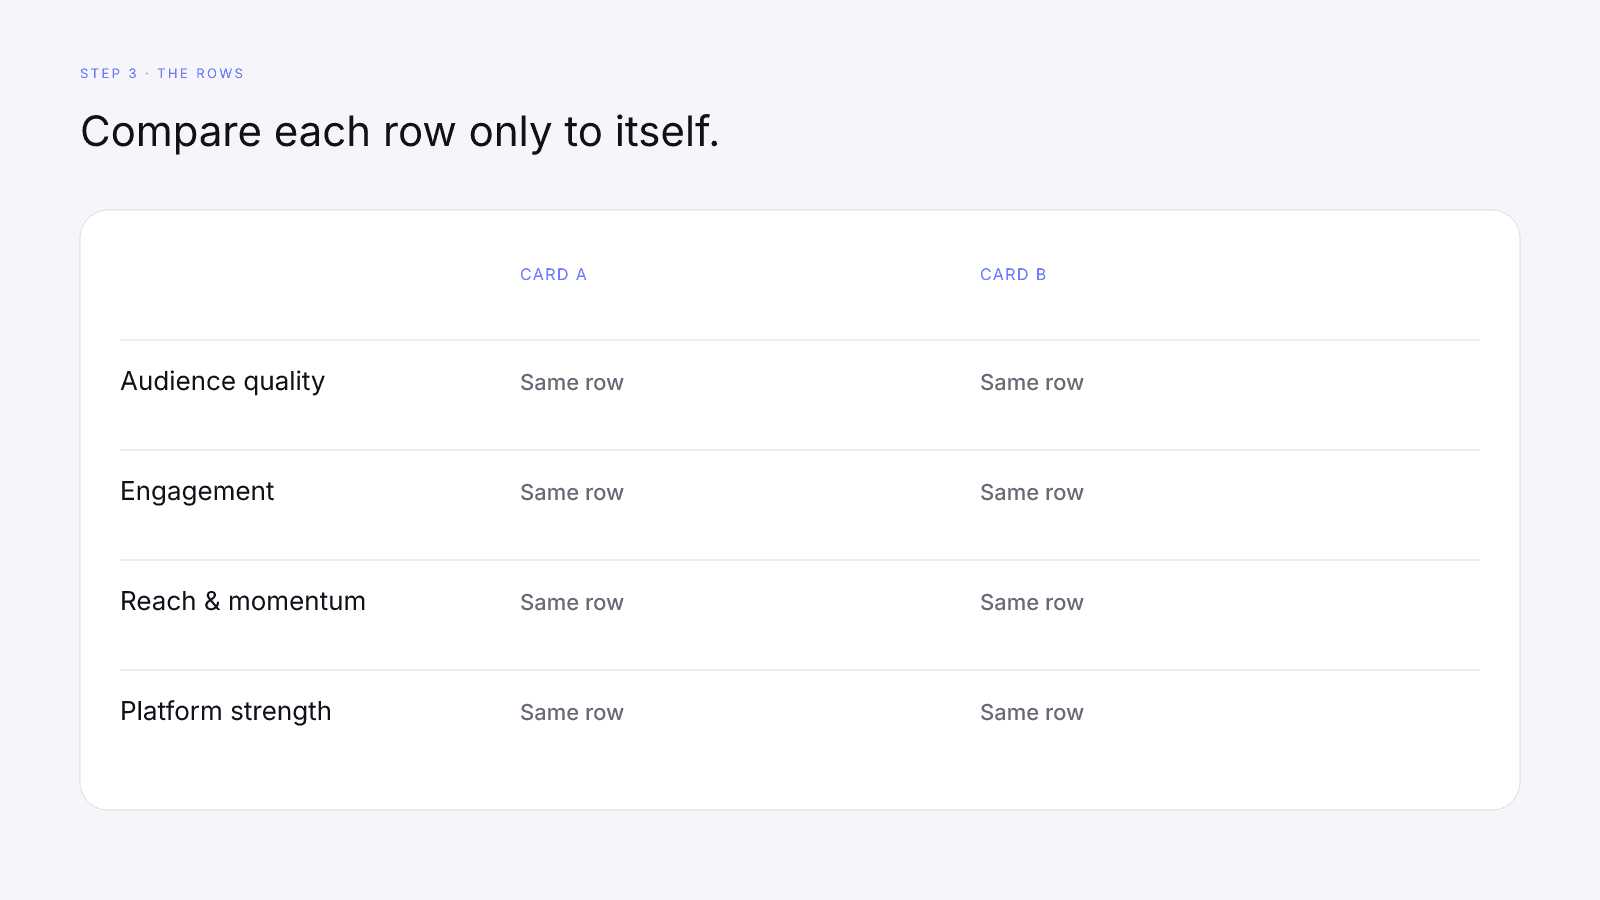
Write the cells down. Eight numbers if both cards are full. Fewer if a dash is present. A higher engagement factor does not cancel a dashed audience-quality row on the other card, and a higher platform-strength row does not cancel a thin reach row. The rows do not borrow. Only after those cells are written should you look at the 0–100, and only if the model id, the surface, and the coverage still match the comparison you meant to make.
How to Read an Influencer Scorecard is that order on a single card: coverage, dashes, factors, then the number. A second creator adds the stamp and the surface in front of the list. It does not add a winner.
What a fair comparison can and cannot tell a brand
A matched pair can tell you whether the stamps agree, whether you opened the same kind of public surface, whether coverage matches, which factors are dashes, and which observed row is higher on the same 0–100 factor scale. That is a reading. It can support a shortlist note in plain language: same model, same surface, coverage 100 on both, then the four rows. The note is about those rows.
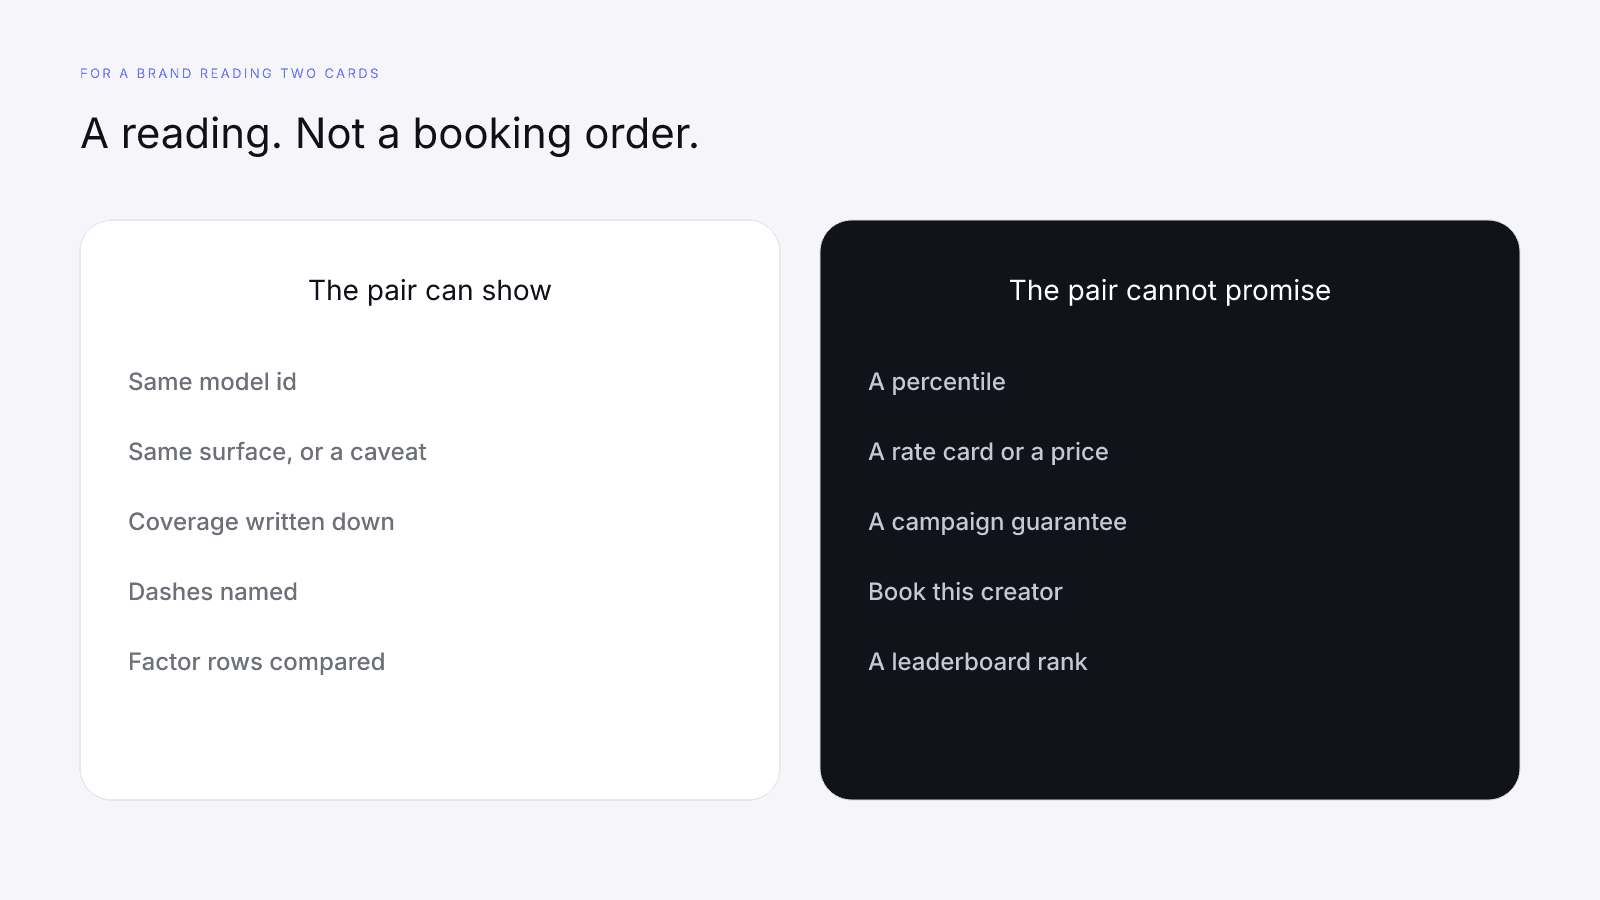
A matched pair cannot tell you the price, the percentile, or the campaign result. InfScore is not a rate card or a rank of creators inside a category. A higher score does not mean book this one. Tiers are bands on the card you are holding. They are not a head-to-head result. Two Emerging cards can differ by a point because one row moved. Two cards in different tiers can differ because one of them is missing audience quality and the weights rebalanced. The tier label will not say which of those happened. The rows will.
Nothing in the composite promises a campaign result or a price, and it does not prove fit for a brief you have not written down. The public work that can move a later fetch under the same stamp is ordinary: a credible audience, real engagement, real reach, and platforms that actually have an audience. That path is Ethical Ways to Improve Your InfScore. Manufactured comment volume is not a way to win a comparison against another handle. That limit is Why Engagement Pods Usually Hurt Public Influence Scores.
The free InfScore needs no signup. Pricing is one report for $0.99, once, with no subscription. The report unlocks the full creator report, with audience, growth, and platform deep dives when they exist. Same weights. Paying does not change the 32/27/23/18 mix, fill a dash, or make two cards comparable. If the free cards are not a fair pair, the paid report does not turn them into one.
Common traps when two numbers look decisive
A few habits produce a fake ranking. None of them require the two creators to have been read carefully.
An Instagram card beside a TikTok card can share a model id and still fail the surface lock. The higher composite is not the better creator. Write the platform from the URL next to the number. If the platforms differ, the note should say the surfaces differ. Then compare rows only with that caveat, or open the same surface for both handles when that public profile exists.
Tiles on the marketing page are illustrative. They are not live proof or a pair you can difference against a score URL. Open the score URL. Read the stamp on that page. Leave the tile where it is. A homepage sample is not the card you will defend in a shortlist.
When two headlines are close, the larger audience is a tempting tiebreaker. Followers feed reach & momentum. They are not a second InfScore or audience quality. A larger total can sit next to a weaker credibility row, or next to a dash where credibility never came back. Do not let the follower line overrule a coverage mismatch.
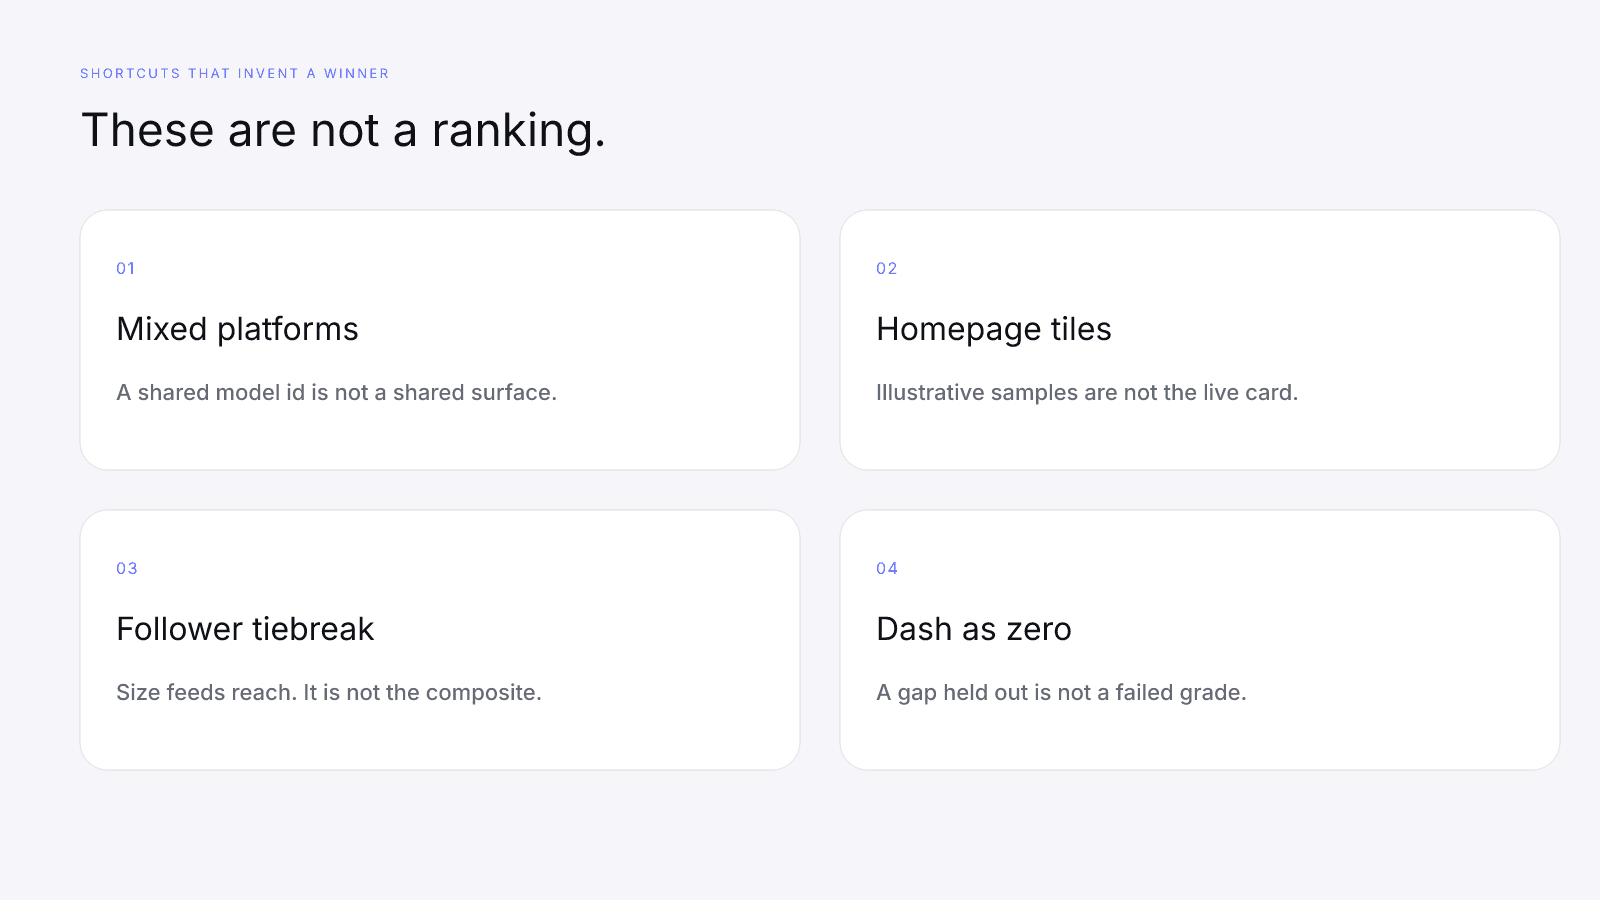
Another trap is the dash typed as zero. The card shows a dash because the signal is missing. Putting 0 in the spreadsheet punishes a blind spot and changes the average. A related trap is two model ids treated as one formula. If the stamps disagree, you are not comparing creators. You are comparing versions. Stop and cite both ids.
The order that avoids those traps is short:
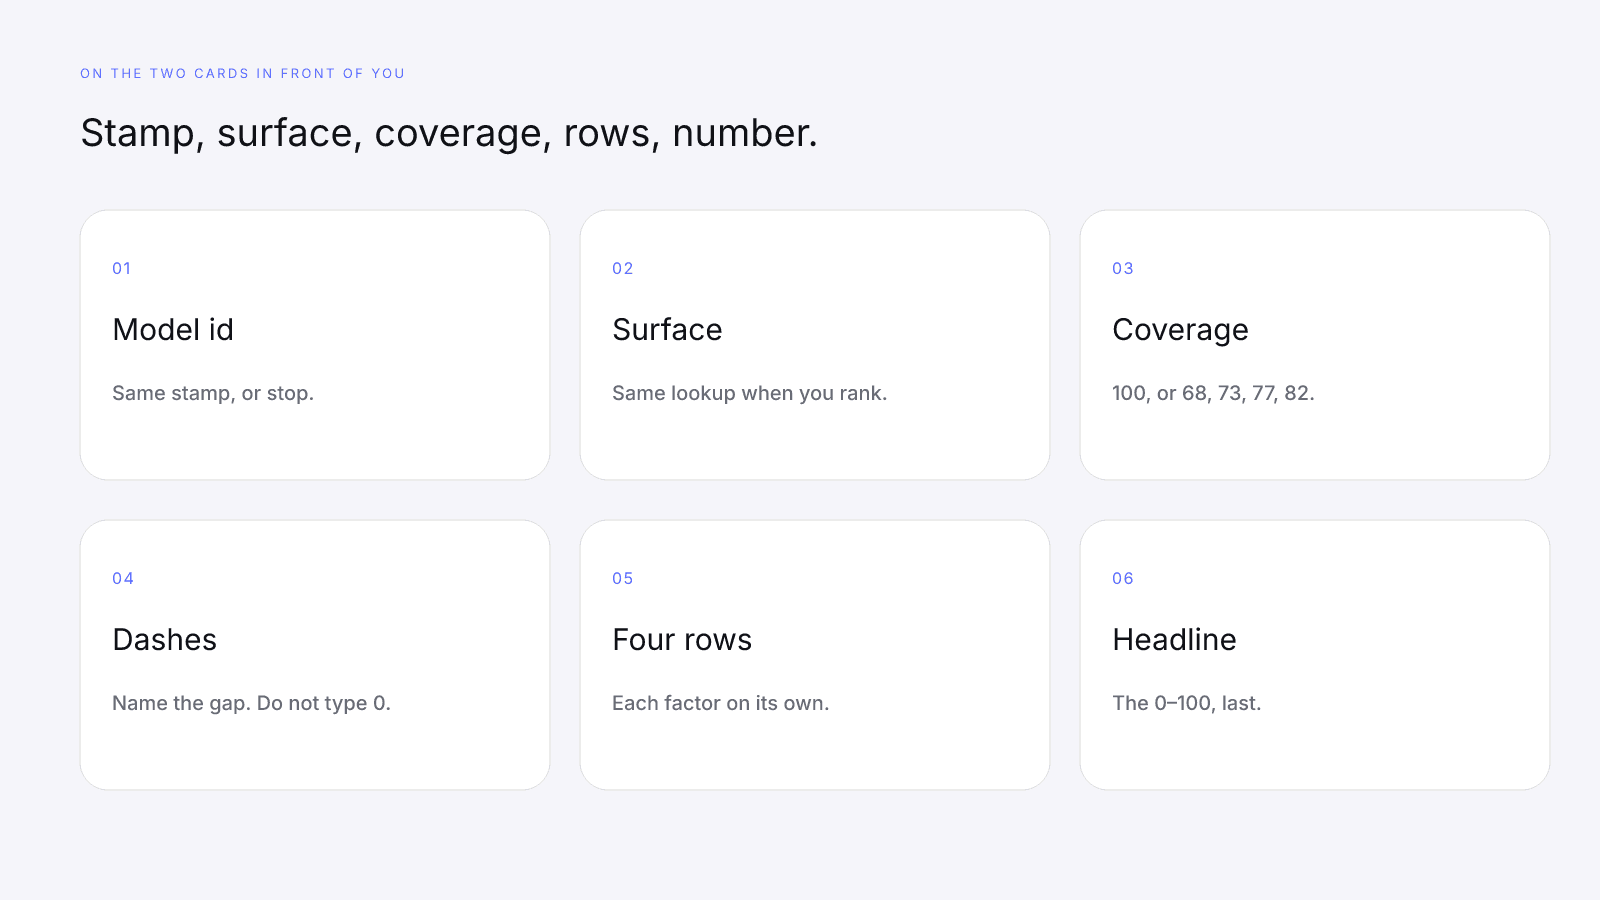
- Model id. Same stamp, or stop.
- Platform surface. Same lookup when you are ranking. If not, write that the surfaces differ.
- Scoring coverage. 100, or 68, 73, 77, or 82 when one published weight is the one that is missing.
- Dashes. Name the missing factor. Do not type a zero in its place.
- Each factor on its own. Audience quality, engagement, reach & momentum, platform strength. They do not borrow.
- The composite and the tier, last. Then decide whether the gap is about the rows you actually compared.
A reading drill on three live cards
Three live lookups, opened on 2026-10-05, are a drill in that order. Each card prints model 2026-08-18.1. They are three people on three surfaces. The table is not a ranking or a verdict about who to book. A fair side-by-side of two creators needs the same model id and, when you are ranking, the same surface. These three share the stamp and fail the surface lock. They are here so you can see coverage 100 beside coverage 68, and a filled audience-quality row beside a dash, without subtracting.
| Live lookup | Model id | Surface | Coverage | Audience quality | Engagement | Reach & momentum | Platform strength | Composite |
|---|---|---|---|---|---|---|---|---|
| Emma Chamberlain, Instagram | 2026-08-18.1 | 100 | 84 | 49 | 83 | 45 | 67, Emerging | |
| Khaby Lame, TikTok | 2026-08-18.1 | TikTok | 68 | dash | 100 | 85 | 70 | 87, Rising |
| MrBeast, YouTube | 2026-08-18.1 | YouTube | 68 | dash | 24 | 100 | 95 | 69, Emerging |
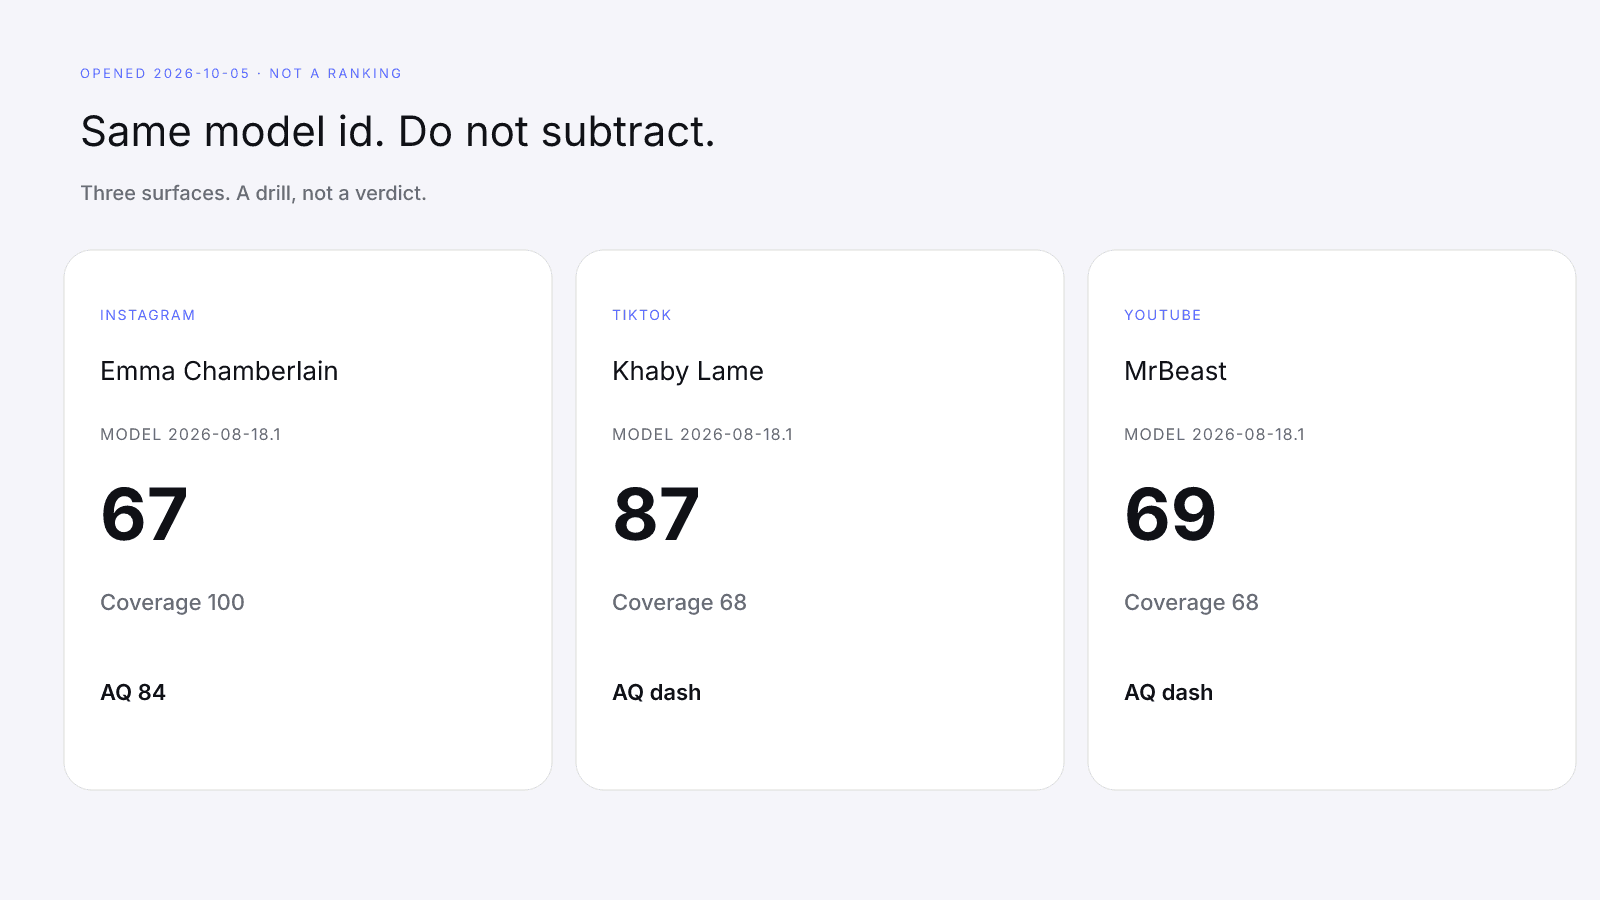
Do not compute 87 minus 67, or 87 minus 69, or 69 minus 67, and call the gap a winner. The ids match. The people do not. The surfaces do not. The TikTok handle on that URL is khaby.lame.
Emma is the full-coverage card. Check the mix under this one id: (84 × 32 + 49 × 27 + 83 × 23 + 45 × 18) ÷ 100 = 67.3, which rounds to 67. The public engagement rate on that card is 3.9%, and 3.9 ÷ 8 × 100 rounds to 49. Audience quality is 84. Both rows are present. 49 is not the InfScore. The card displays about 14 million public followers. That total feeds reach. It is not a second score or a reason to rank this URL against the other two.
Khaby and MrBeast are the partial cards. Audience quality is a dash, not a zero, so coverage is 68 (27 + 23 + 18). Khaby's public rate is 8.99%, which is past 8%, so engagement is capped at 100. The composite is (100 × 27 + 85 × 23 + 70 × 18) ÷ 68 = 86.985, which rounds to 87. MrBeast's public rate is 1.95%, so engagement is 1.95 ÷ 8 × 100, which rounds to 24. The composite is (24 × 27 + 100 × 23 + 95 × 18) ÷ 68 = 68.5, which rounds to 69. Those cards display about 163 million and about 745.3 million public followers. The missing 32% is not inside the engagement factor. A dash stays a dash. The higher headline on the partial TikTok card is not a win over the full-coverage Instagram card. The evidence bases differ, and the surfaces differ.
Use the same order on the two creators you actually need to choose between. If the model id is not 2026-08-18.1, you are not lining that card up against the three above. Cite the stamp you see. If coverage differs, say the evidence differs before you quote either headline. If a row is a dash, leave it a dash.
Search a public profile on infscore.com. Read the model id, the platform, the coverage, and the dashes before you read the 0–100. If the second card matches on those points, compare each factor, then the headline. If it does not match, you have two readings, not a ranking.
This versioned composite uses only available public creator signals. Missing factors stay unavailable and their weight is rebalanced across observed factors. It is not a percentile, a price estimate, or a guarantee of campaign results.
FAQ
Can I compare two creators on different platforms?
You can open both cards. Treat them as two lookup surfaces of the same composite, not as a finished ranking. Instagram, TikTok, and YouTube use one formula. On model 2026-08-18.1 the weights are audience quality 32%, engagement 27%, reach and momentum 23%, and platform strength 18%. The public inputs and the coverage can still differ. A higher headline on a different surface is not, by itself, proof that one creator is the better pick. Match the surface when the decision is a ranking. If the surfaces differ, say so and compare the factor rows.
What if one creator has dashes and the other doesn't?
Then the evidence bases differ. A dash is a missing public signal, not a zero. Its weight is held out and the remaining weights are rebalanced. Coverage 100 and coverage 68 are different denominators. Do not rank the two headlines as if both composites used all four factors. Name the missing row first.
Is a higher InfScore always the better pick?
No. A higher 0–100 is the rebalanced mix on that card. It is not a percentile, a rate card, a price, or a campaign guarantee. It does not mean book this creator. Read the model id, the platform surface, the coverage, the dashes, and the four rows before you treat the gap as a decision.
Do both scores need the same model id?
Yes, if the gap is supposed to say something about the two creators rather than about the formula. Live cards opened on 2026-10-05 print model 2026-08-18.1. If the stamps differ, stop. That is a version change, not a creator comparison. Cite the id printed on each card.
Does the $0.99 report make two creators comparable?
No. The free InfScore needs no signup. The $0.99 report is a one-time unlock of the full creator report, with audience, growth, and platform deep dives when they exist, not a subscription. Paying does not change the 32/27/23/18 weights, fill a dash, or make two cards comparable.
What should I compare first?
The model id, then the platform surface, then scoring coverage, then every dash, then the four factor rows. The headline number is last. The public score page shows one card at a time. Open two URLs and keep notes. Nothing on that page loads a second creator beside the first.
Does InfScore rank creators against each other?
No. Each card is one composite for one public profile. InfScore does not publish a leaderboard or declare a winner between two handles. Tiers are bands on the card you are holding. Elite is 90–100, Rising is 80–89, Emerging is 65–79, and Developing is below 65. A higher band is not a ranking against the other creator.