How to Check for Fake Followers Without Accusing Anyone
How to check fake followers without accusing anyone: read audience credibility as a signal, what it can't prove, and the manual checks to run next.
This versioned composite uses only available public signals. Missing factors stay unavailable and their weight is rebalanced across observed factors. It is not a percentile, price estimate, or guarantee of campaign results. Model 2026-08-18.1.
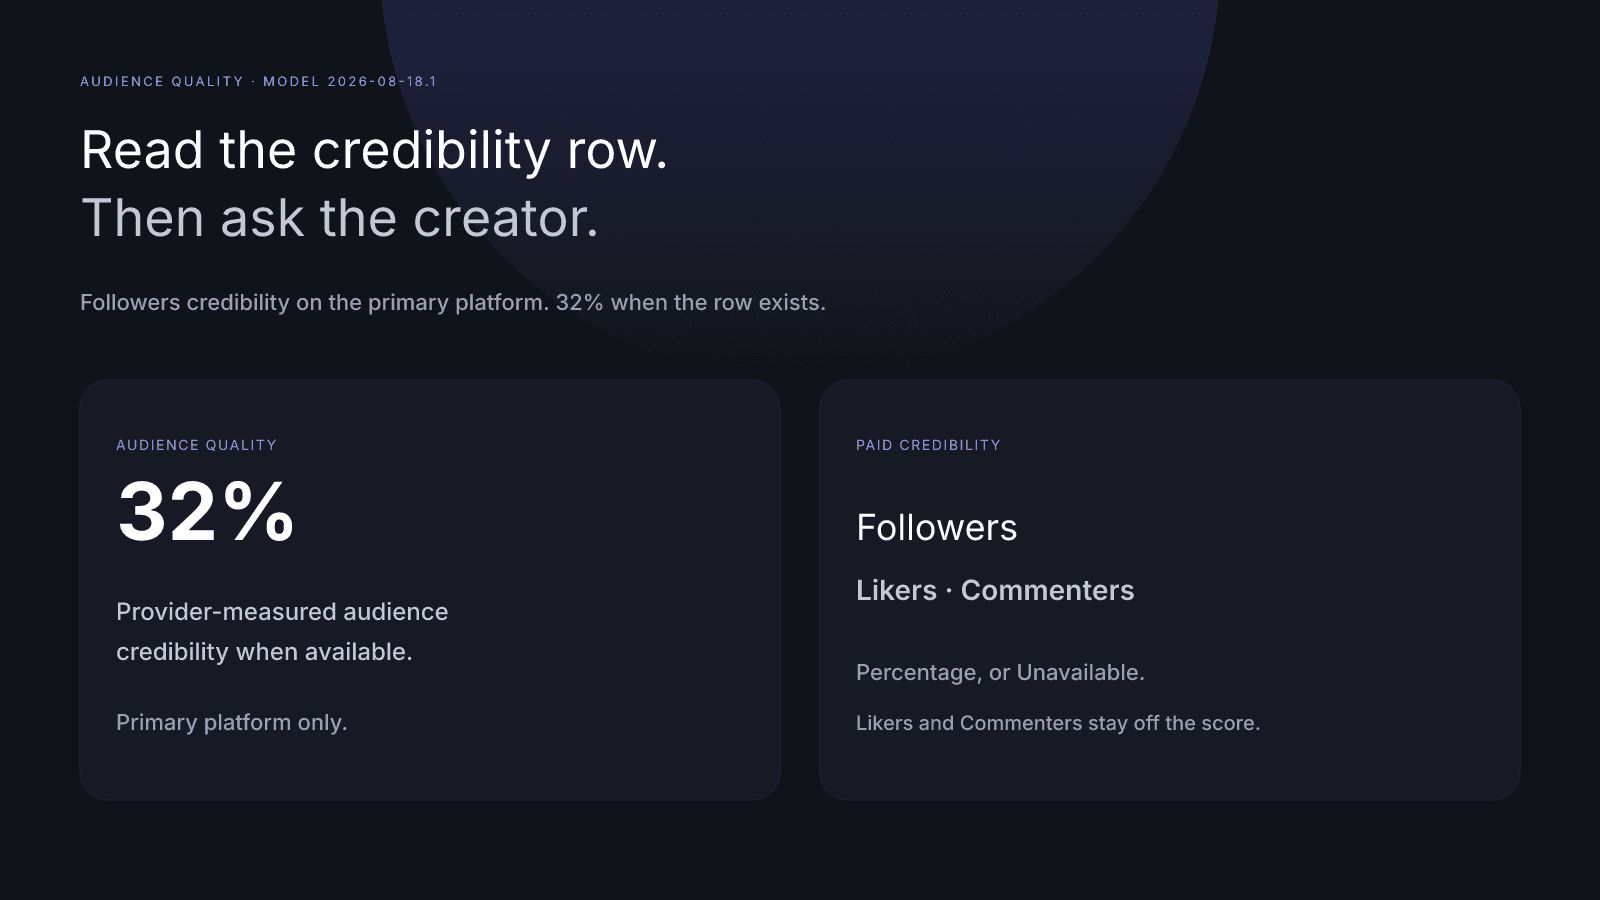
Brands ask how to check fake followers because a follower total only tells you size. No outside tool can prove that an account's followers are fake. What you can read is a credibility signal, and then you check the rest by hand. A low credibility reading is a reason to look closer, not proof. On InfScore that signal is the free card's audience quality row: the provider-measured followers-credibility percentage for the primary platform, weighted 32% on model 2026-08-18.1 when the row exists. Engagement strength is 27%, reach and momentum is 23%, and platform strength is 18%. If the percentage didn't come back, the row shows a dash and its weight is held out. A dash on audience quality is missing data, not a red flag or a zero.
Why High Follower Counts Still Score Low covers the case where the follower total is large and the composite isn't. This page doesn't re-teach it. It sticks to the check itself: what the signal measures, what the paid module adds, and how to bring the topic up without accusing anyone.
How to check fake followers: what you can and can't prove
Keep five facts in mind before you draft a note.
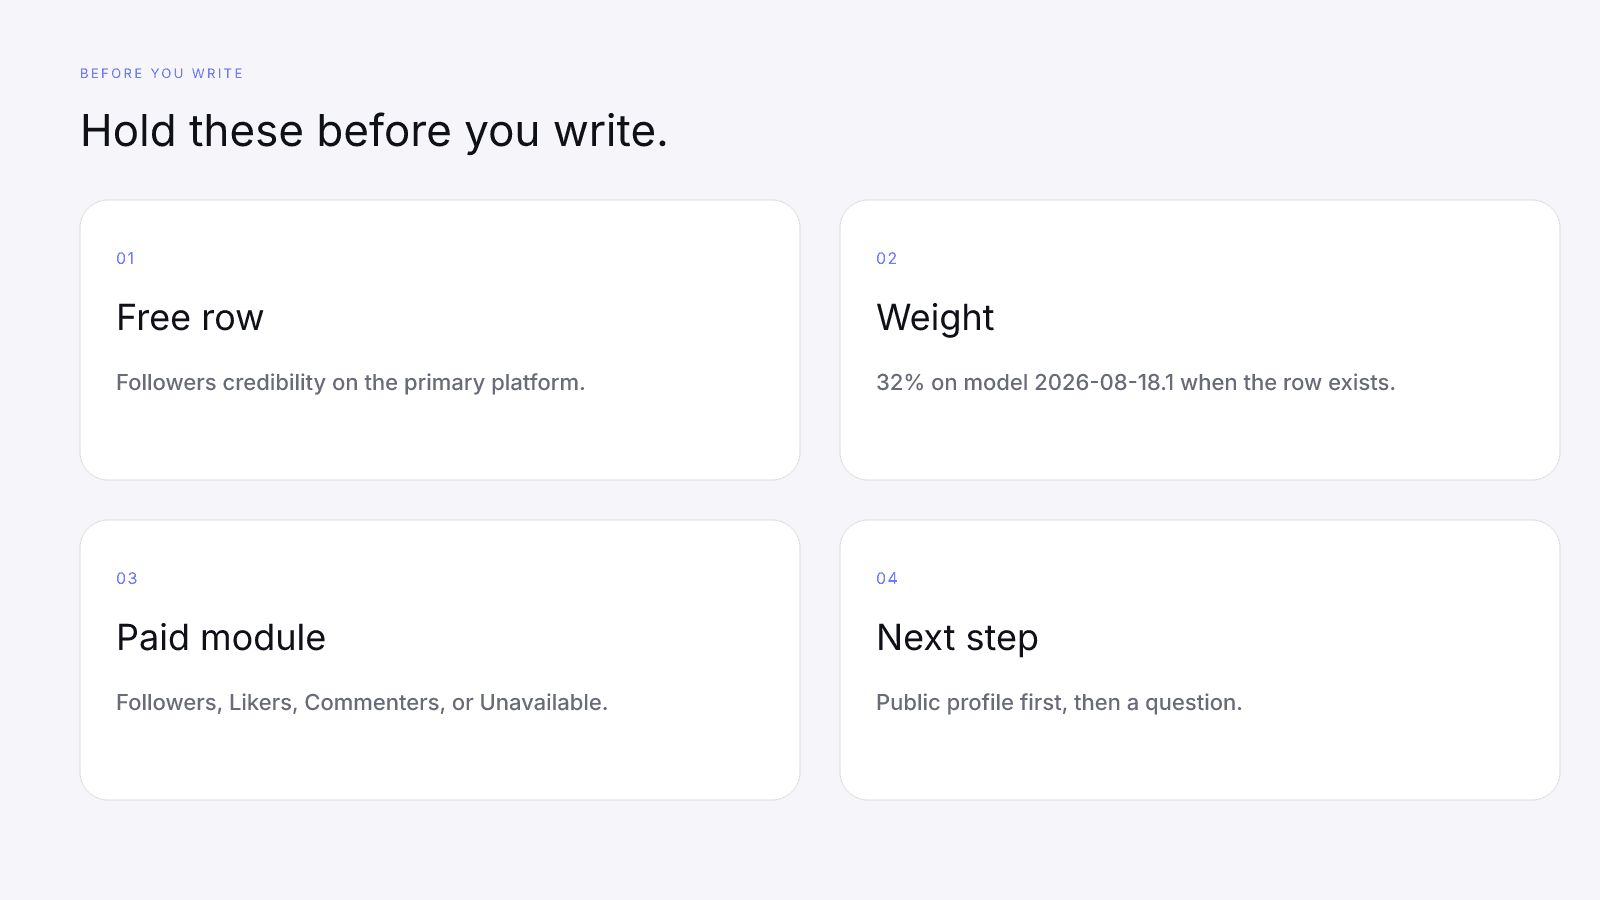
- The free audience-quality row is the followers-credibility percentage for the primary platform. On model
2026-08-18.1it carries 32% when the row exists. - The paid Credibility module shows Followers, Likers, and Commenters. Each cell is a percentage or the word Unavailable. A credibility mix and a credibility label are optional.
- Likers and Commenters percentages are paid displays and don't feed the score. Neither does a credibility mix or a credibility label.
- A dash on audience quality means the percentage was missing on that fetch, and the weight is held out.
- The useful next step is public context plus a question to the creator. The row doesn't identify accounts, and this page publishes no cutoff.
The followers-credibility percentage is a provider measure for the follower audience on one platform. It doesn't list accounts, predict who will watch a sponsored post, or set a price. The limit printed on the card still applies: the composite is not a percentile, a price estimate, or a guarantee of campaign results.
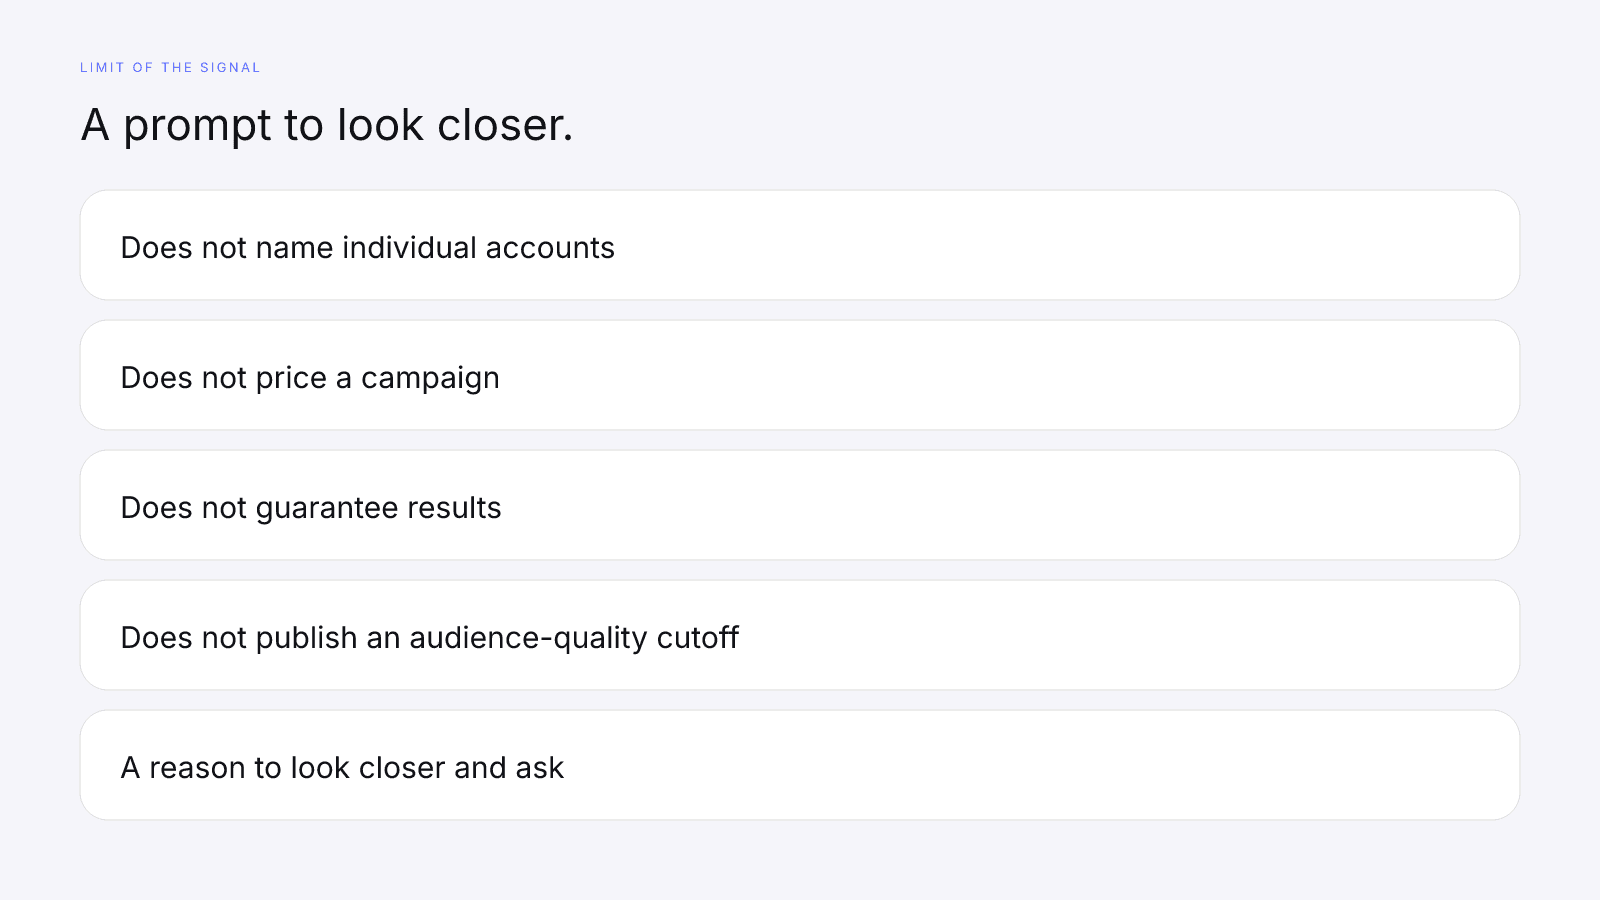
InfScore is not a fraud detector. In a brief, or in a note to a creator, don't write that InfScore detected a problem with their followers. The product publishes no audience-quality cutoff, and neither does this page. A lower row is a reason to read coverage, the other three rows, and the public profile, and then to ask. A higher row is still one measure on one fetch, so if the brief depends on who the audience is, ask anyway.
If the creator disagrees with the percentage, record both. The row is the provider's measure on that fetch; the description is the creator's. The product doesn't referee between them. Your brief can hold the number (or the word "missing"), the coverage, the model id, and the creator's own words, and a buying decision can weigh all of it. The card won't reduce that to a pass or a fail.
What audience credibility measures
The free card prints four factor rows, and audience quality comes first at 32% on model 2026-08-18.1. When the provider returns a followers-credibility percentage for the platform you searched, that percentage is the row's input. Each card has one primary platform, and a followers-credibility figure from another platform doesn't stand in for it. Audience Quality vs Follower Count sets the 32% row against follower count in more detail.
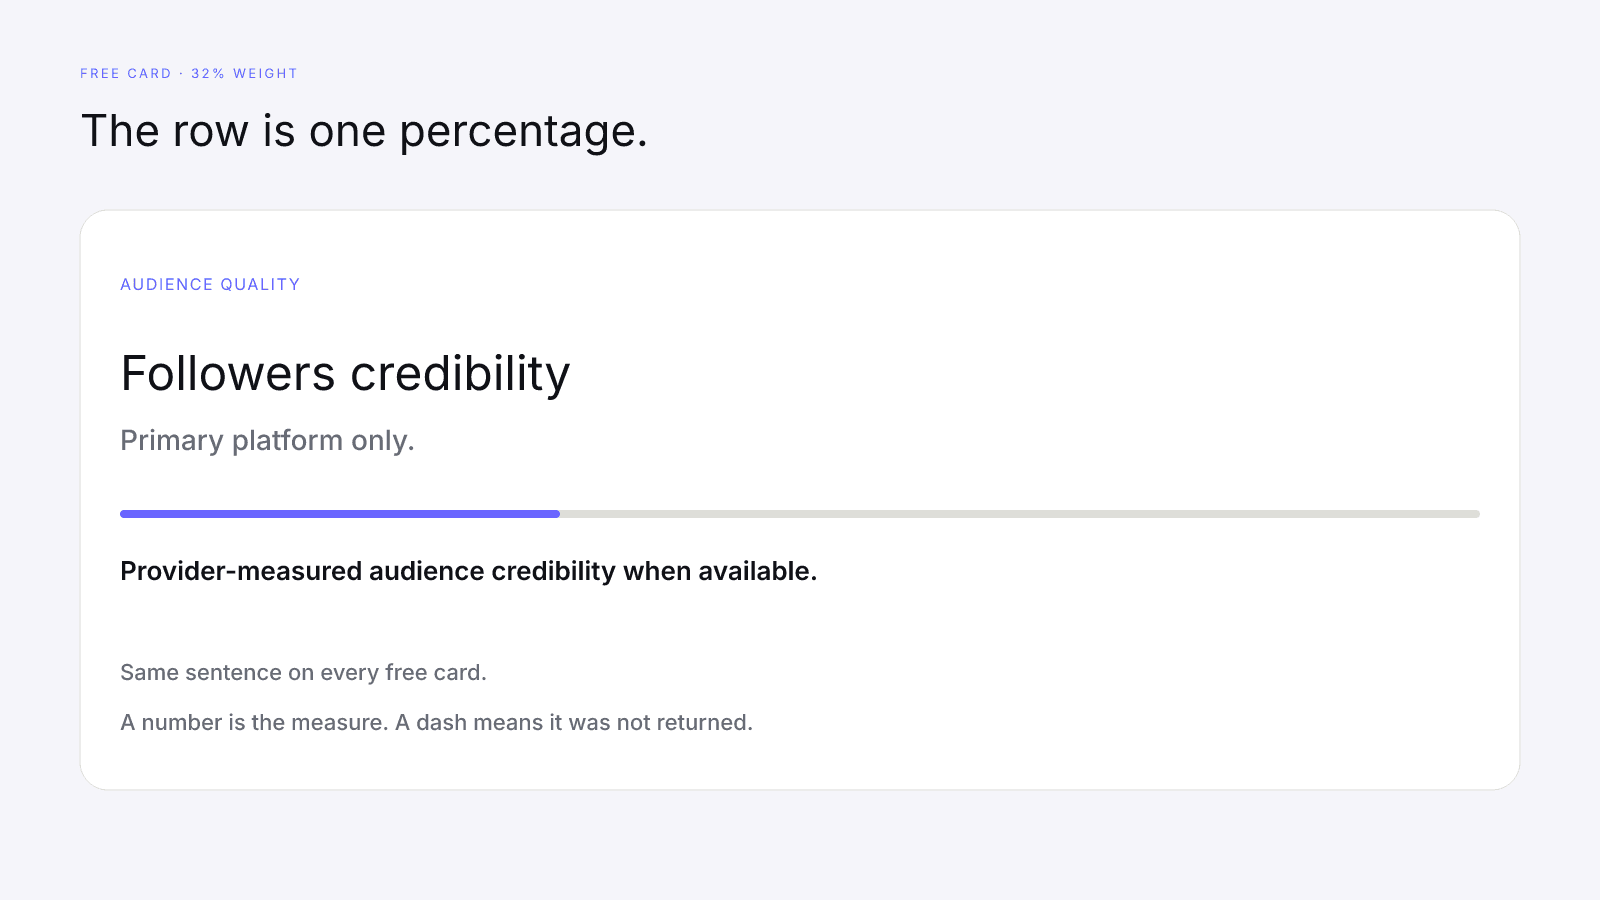
Every free card carries the same line under the row: "Provider-measured audience credibility when available." A number there is the measure. A dash means the measure wasn't returned.
The other three rows have their own inputs. On model 2026-08-18.1, engagement strength is 27% and maps the provider-reported public engagement rate onto a fixed 0–8% scale. Reach and momentum is 23%, and platform strength is 18%. How to Measure Influencer Performance walks through those rows. They sit beside audience quality so you can see the weighting, but they aren't a second credibility check, and a strong engagement row can't fill in a missing audience-quality row.
When the card prints a follower count, it feeds reach and momentum, not audience quality. Micro vs Macro Influencers covers how size enters the score. In the note you send, cite the row you mean.
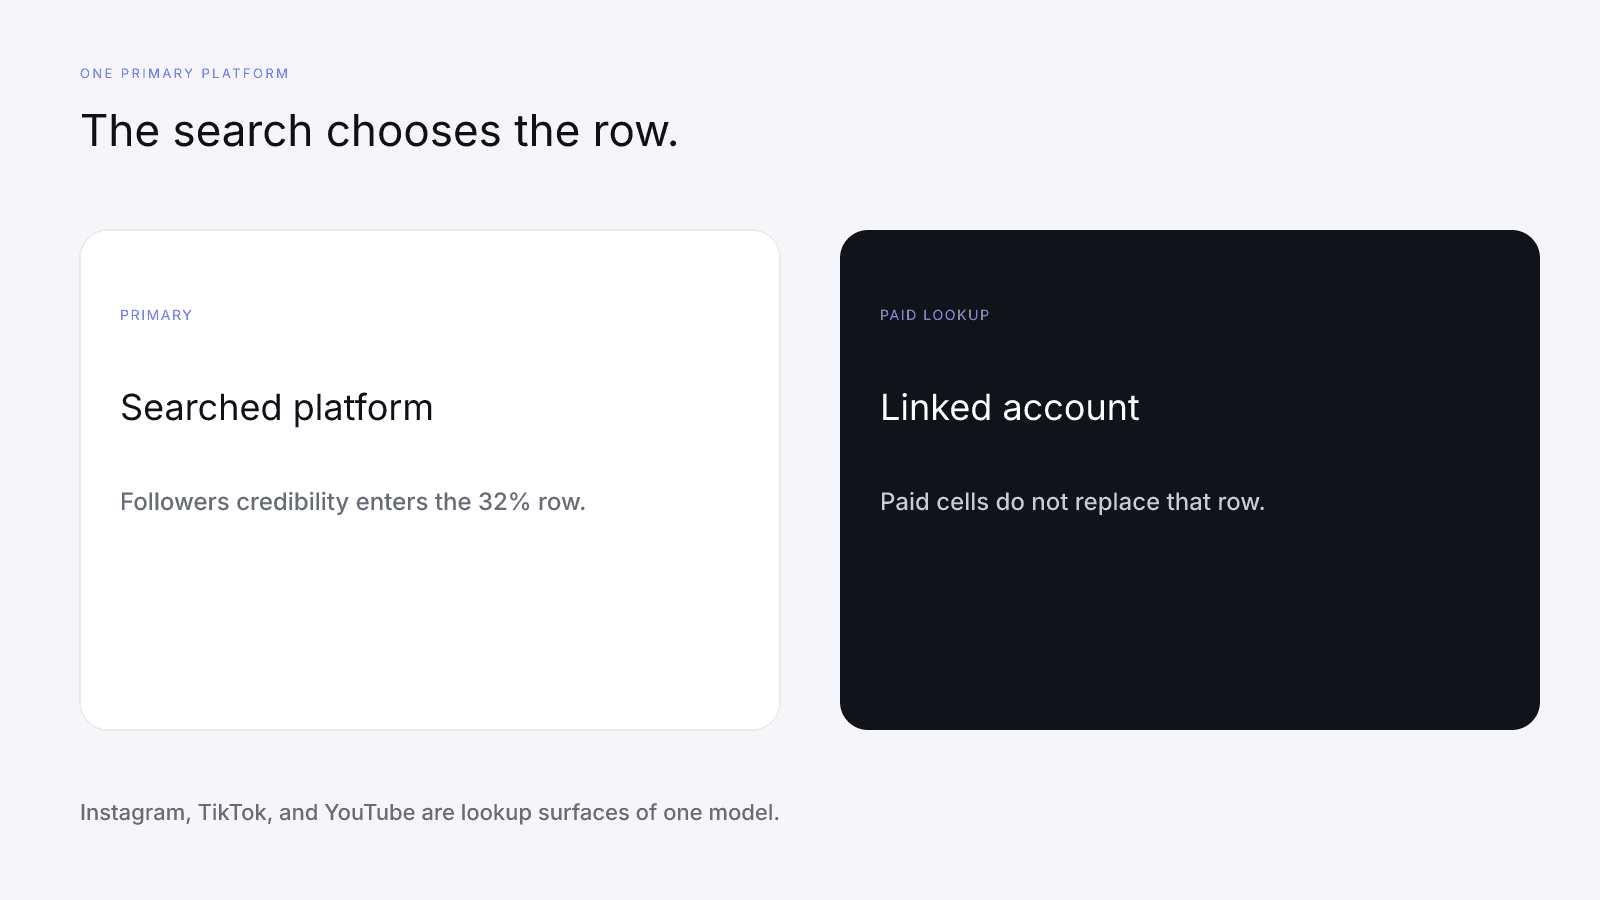
Searching on Instagram, TikTok, or YouTube sets the primary platform for that card. The paid report may also include a lookup for a linked account, but those extra modules don't rewrite the free row. Free InfScore vs the $0.99 Report explains where the card ends and the report begins. Paying is not a way to swap in another platform's followers-credibility percentage and call it the score.
Where it shows up in InfScore
On the free card, credibility shows up in one place: the audience quality row described above. The $0.99 purchase is the full creator report, with audience, growth, and platform deep dives when they exist. Inside Audience, when the provider returned audience data for a platform, one block is headed Credibility.
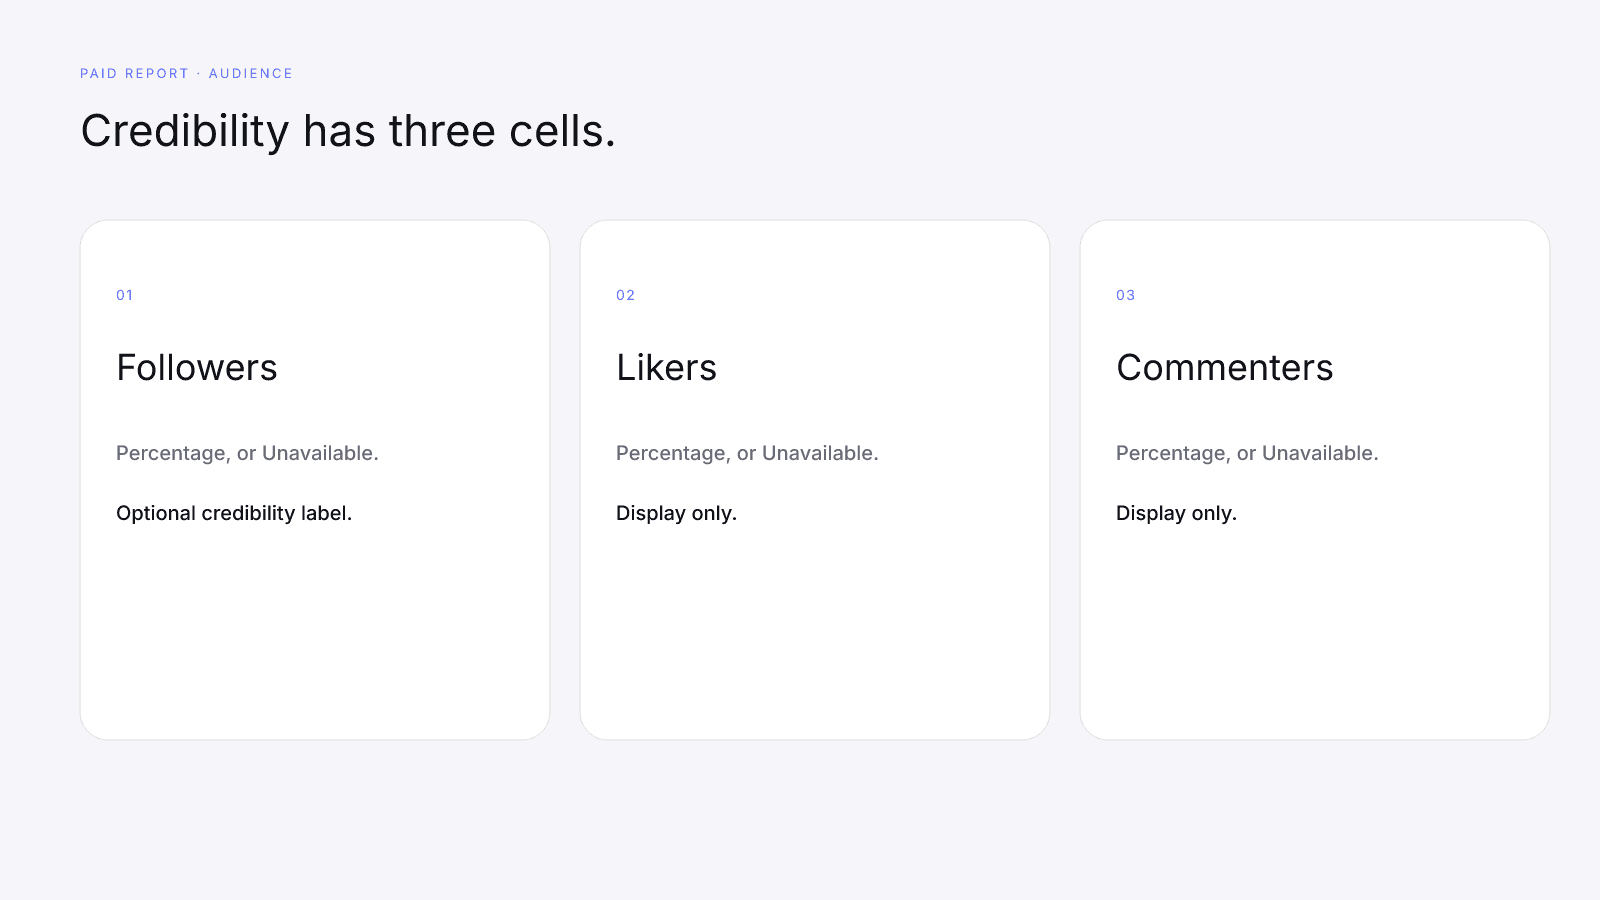
It has three cells:
- Followers: a percentage or the word Unavailable. When the provider also returned a label, the cell shows a credibility label under the percentage.
- Likers: a percentage or Unavailable.
- Commenters: a percentage or Unavailable.
Unavailable means the field wasn't returned. It doesn't put a zero into the free audience-quality row, and a dash on that row is still a dash after you pay. Go by the words on the report you opened, and don't carry a percentage over from another creator. The other audience fields, such as gender, age, countries, cities, and interests, are covered in Influencer Audience Demographics: What a Creator Report Can and Can't Show.
The Followers cell and the free audience-quality row come from the same provider measure. The free row is what the 32% factor on model 2026-08-18.1 uses, for the primary platform, when the percentage exists. The paid Followers cell displays that measure for whichever platform's audience block you're reading. When both refer to the same platform, read them together; they aren't two separate votes. Don't average Followers with Likers and Commenters and paste the result over the score. The composite already counted the followers figure once, inside audience quality, and only when that row exists.
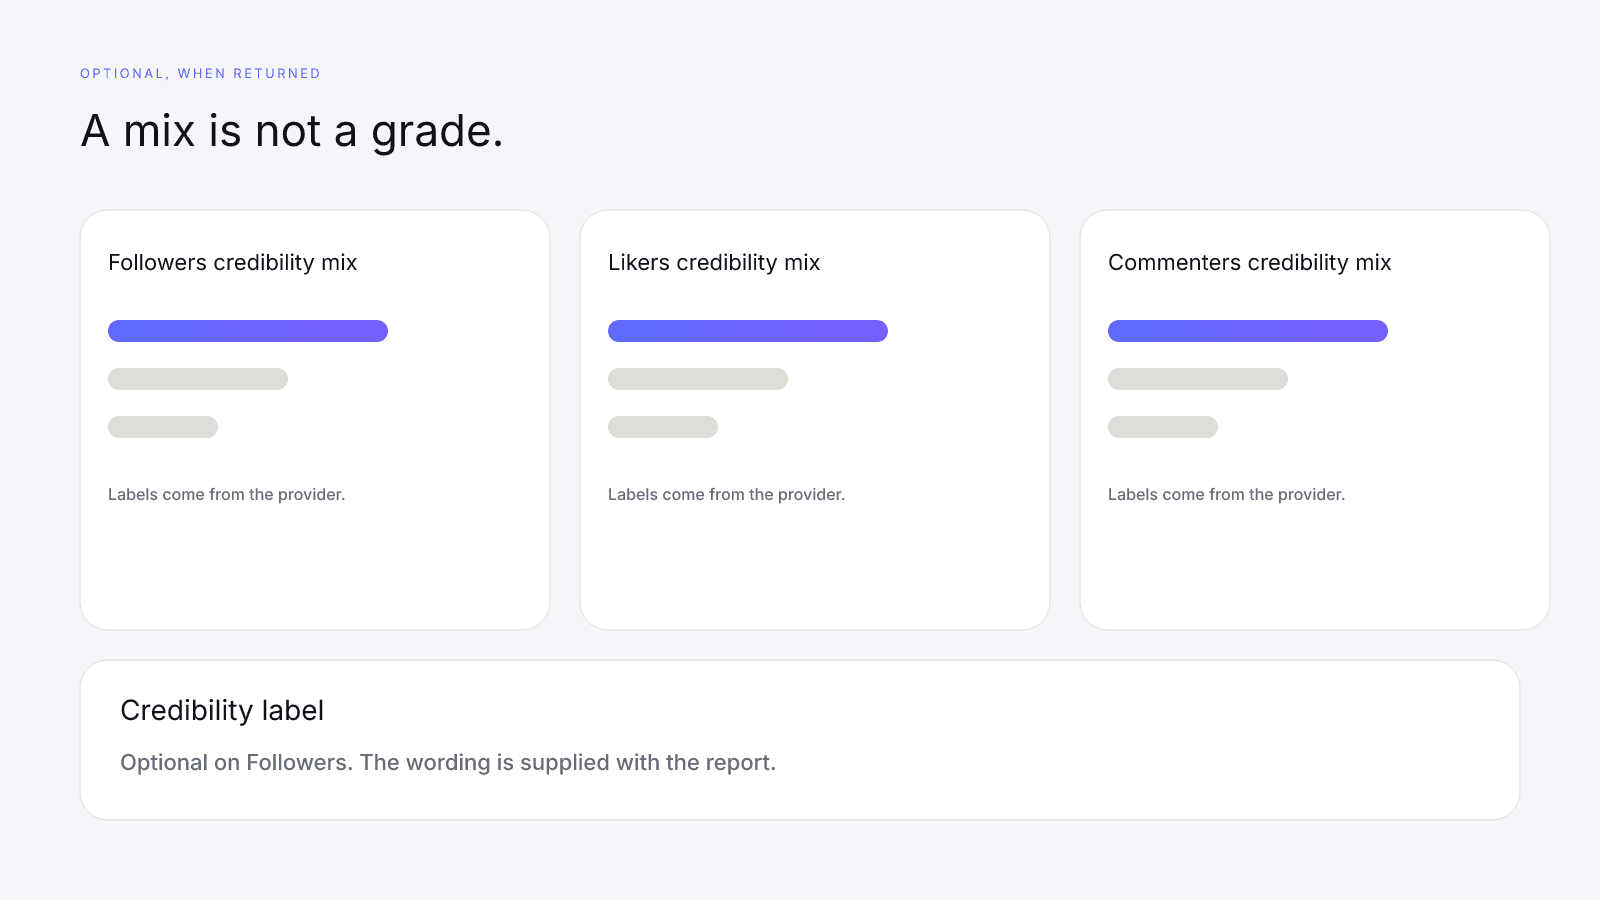
Below the cells the report may show histograms headed "Followers credibility mix", "Likers credibility mix", and "Commenters credibility mix", when those lists exist. An empty list is left out. The bar labels are whatever the provider sent, and this page doesn't define them. InfScore sets no thresholds for them.
The credibility label is optional and only appears on the Followers cell, when one was returned. The wording is the provider's. InfScore doesn't write it and doesn't set a numeric rule for showing it. Quote a label only from the report in front of you, never one you remember from another report.
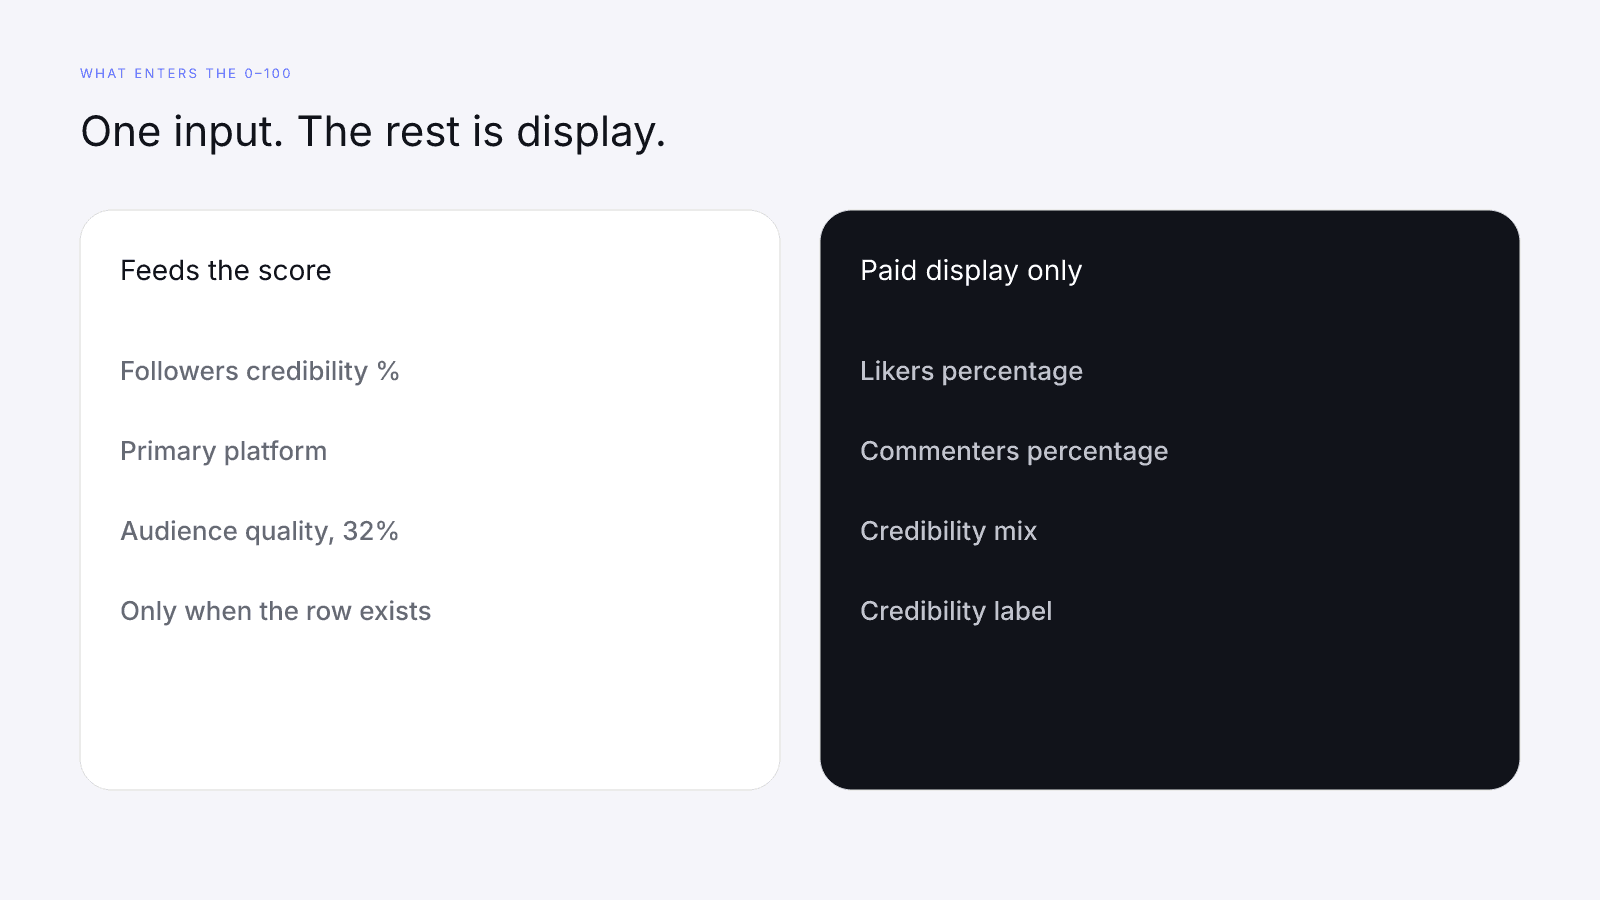
The score reads one credibility input: the followers-credibility percentage for the primary platform. Likers and Commenters credibility stay in the paid module and are not inputs to the 0–100. A high or low Likers percentage can't move audience quality, and a Commenters cell marked Unavailable can't lower it. A credibility mix or a credibility label can't move the 32% weight on model 2026-08-18.1. If the free row is a dash, nothing in the paid module writes a number back into it.
If a teammate wants the 0–100 to reflect Likers or Commenters, they're asking for a different model than 2026-08-18.1. On this model the weights that can run are audience quality 32%, engagement strength 27%, reach and momentum 23%, and platform strength 18%, and audience quality uses the followers measure only.
When you compare two creators, match the model id and the platform first, then read coverage and dashes, and only then the headline. Comparing Two Creators Fairly With InfScore follows that order. The Likers cell is not a hidden tiebreaker for the composite.
Manual checks that don't accuse anyone
None of these steps uses a cutoff. Do them before you write to the creator.
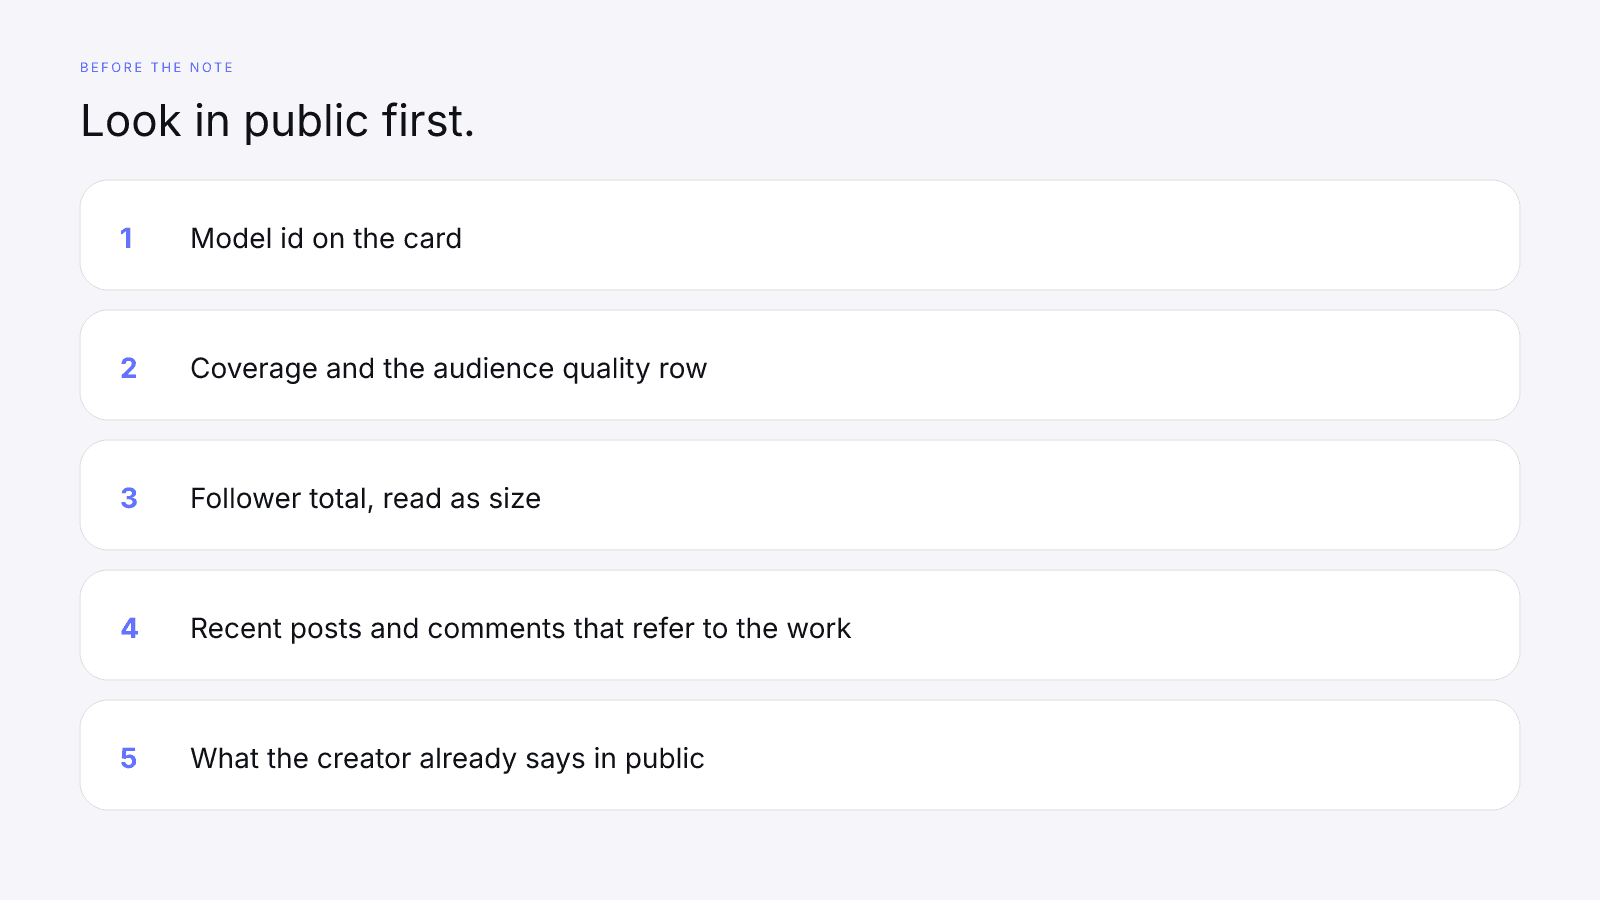
- Copy the model id. This article uses
2026-08-18.1. If the card shows a different id, read the version guide before comparing it with an older screenshot. - Copy scoring coverage and the audience-quality row. A number is the followers-credibility percentage for the primary platform; a dash means "missing".
- Copy the follower total if the card prints one, and treat it as size. Your note should name the row, not argue size against credibility.
- Open the public profile on the primary platform and read several recent posts. Look at comment quality: do comments respond to the post, with a question about the demo, a correction, or a reply from the creator? Comments about the work are context you can mention. A quiet thread isn't a finding, and a busy one isn't proof.
- If follower numbers shifted sharply in a period you can both see, set that against the posting history from the same weeks. A launch, a collaboration, or a viral post often explains it. Ask instead of concluding.
- Read what the creator already says publicly about who the account is for: the bio, a linked page, or a media kit. Then check whether that audience, including where it's located, fits your brief. Knowing their words first lets your question build on something they've already said.
Ignore ratios that get passed around as rules of thumb. This product publishes no follower-to-following cutoff, no minimum comment count, and no audience-quality floor. If a teammate brings one, label it as the team's rule, not the card's. A large follower total next to a composite that surprised you is a job for Why High Follower Counts Still Score Low.
Questions worth asking
Ask about the audience the creator can describe. Quote the row, and leave room for an answer that doesn't match the number.
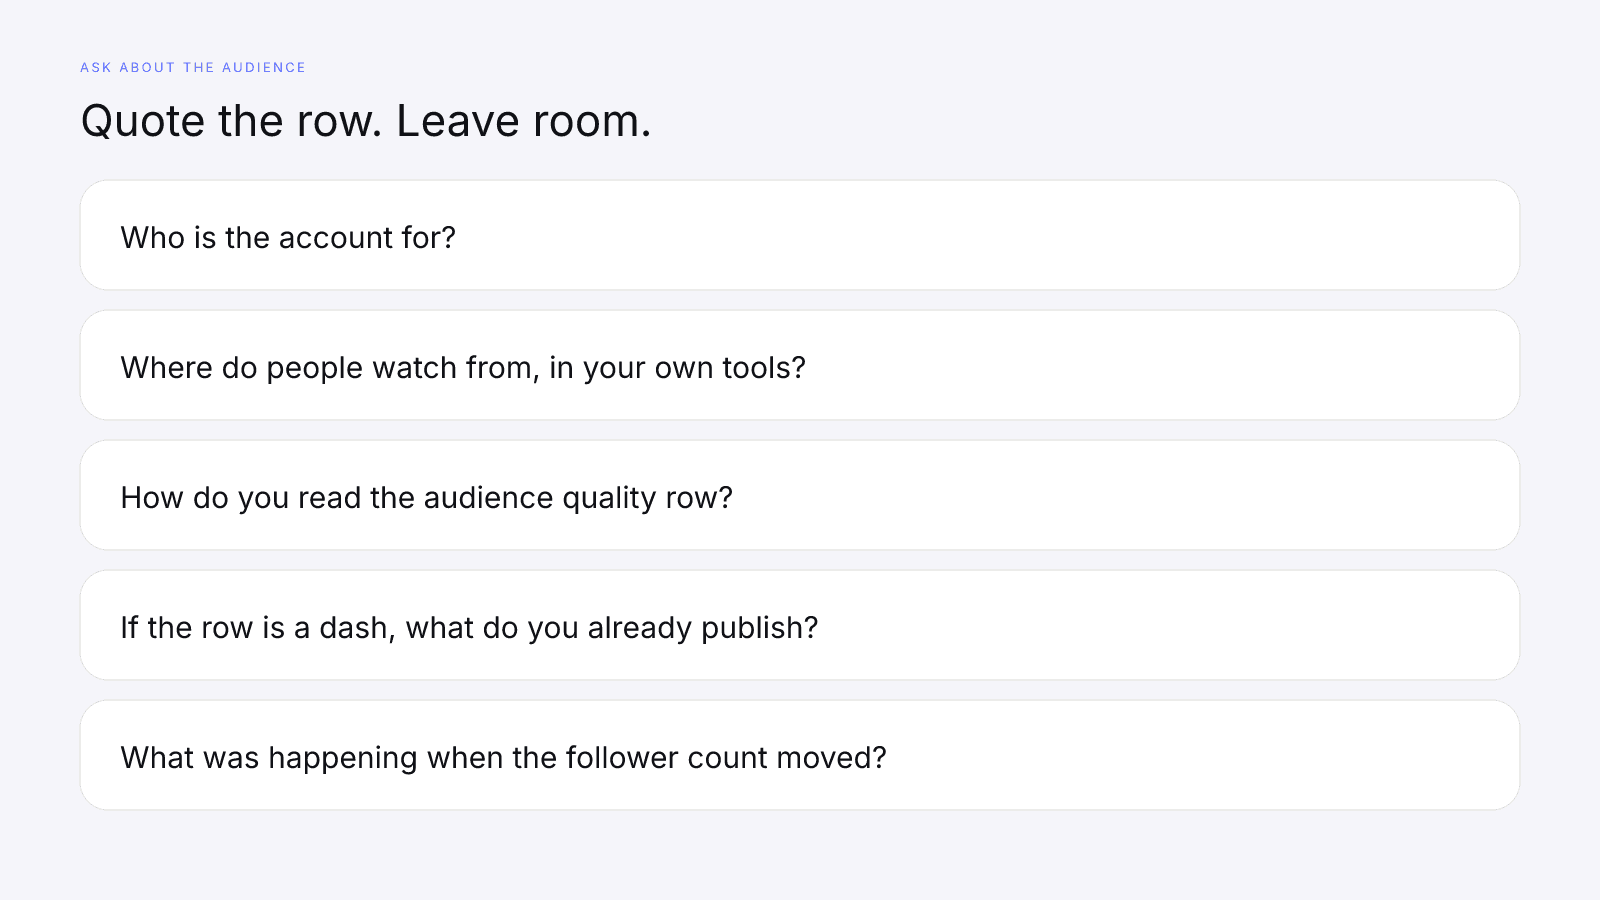
- Who is the account for, in their words?
- Where do they think their viewers are, based on the tools they already use?
- The free card shows audience quality as provider-measured audience credibility for the primary platform, when that signal exists. How do they read it against their own picture of the audience?
- If the row is a dash, the percentage wasn't returned. What do they already publish about who follows them?
- If the follower count changed sharply in a period you can both see, what was happening in their work then? You're asking for context.
If the brief needs a specific place or language, state it as a requirement. Top countries and Languages can appear in the paid audience module when the provider returned them; an empty field prints Unavailable. Don't guess at a country mix to fill the gap. Geography is a separate module from Credibility.
Point to the specific thing in your question. "What do you think of your score?" invites a defense of the headline number. "Audience quality on this card is a dash, so the followers-credibility percentage was missing. What do you already share about who follows you?" names the gap. "The row is present, and we'd like your read on who the audience is before we use it in the brief" explains what the row is for. Neither question asks them to answer a charge.
How to raise the topic
Send the card, name the row, and ask for their read. A short note is enough:
We looked at the free InfScore card for this profile, model 2026-08-18.1. Audience quality is the provider-measured followers-credibility percentage for the primary platform when that signal exists. We would like your read on who the audience is before we use the row in the brief. If the row is a dash, we are treating that as missing data.
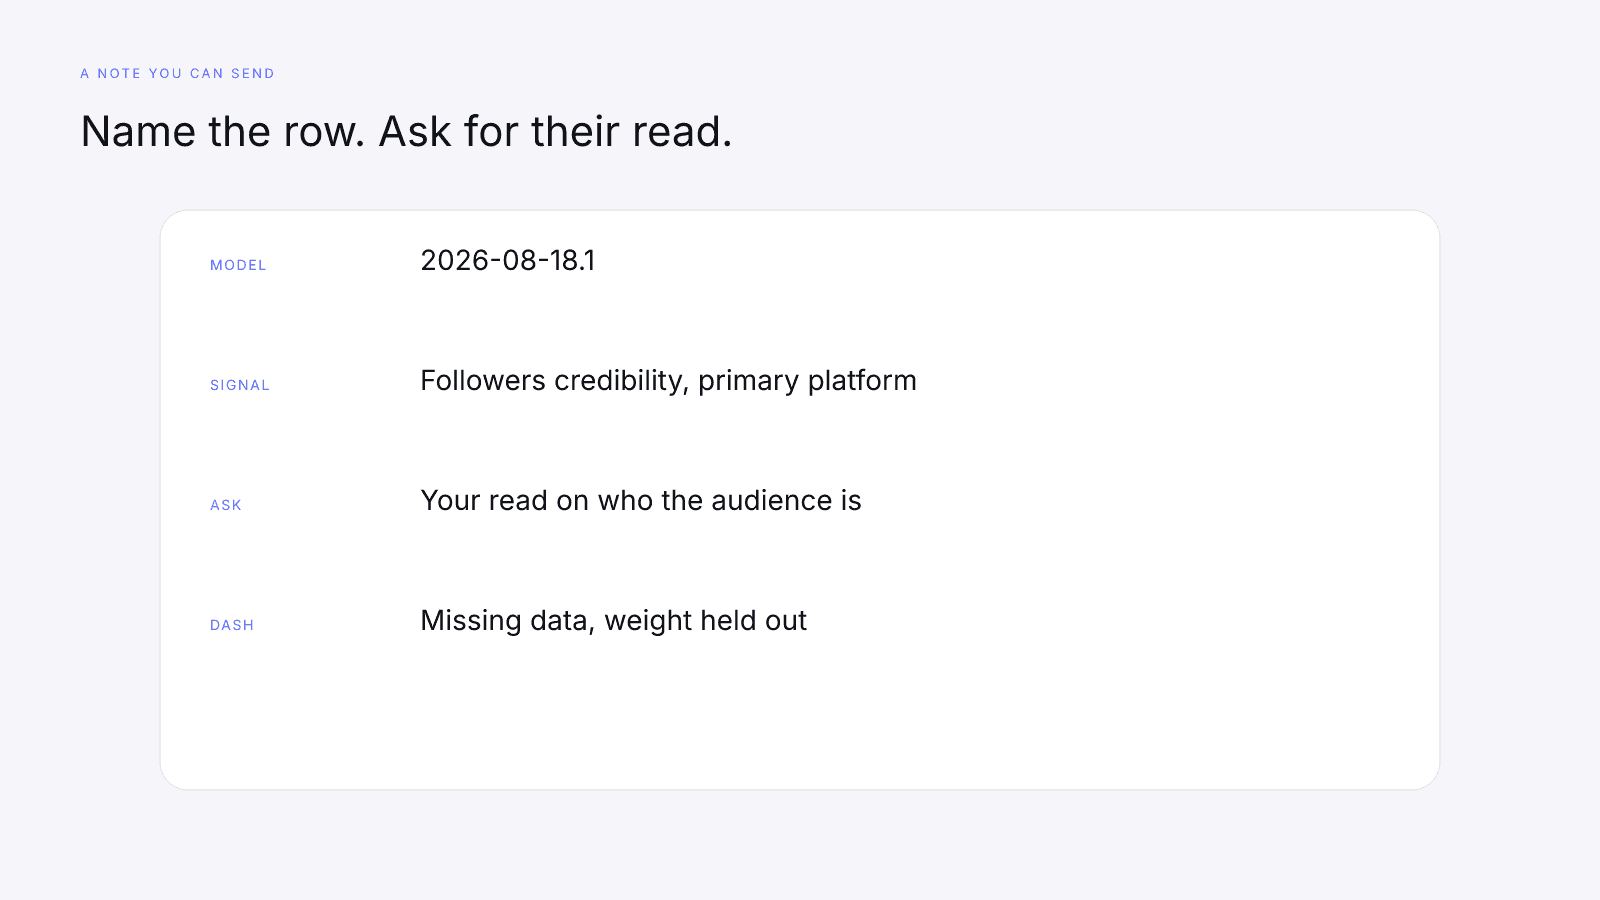
Mention the paid module only if you actually plan to open it:
If we open the report, Credibility may show Followers, Likers, and Commenters as a percentage or as Unavailable, and it may include a credibility mix or a credibility label. We would use those lines to ask a clearer question.
Leave out any minimum score, and don't say the product detected a problem with their followers. Don't paste a histogram bucket into the note as though this site defined it. If the Followers cell on the report you opened has a credibility label, you can ask whether they've seen that wording. Quote only the words on that report, and don't guess what a label will say or borrow one from another report.
If the reply helps, file it next to the row with the number or "missing", the coverage, the model id, and their description. A thin reply means the brief has a gap, not that you've learned something about the people who follow the account. "We need you to explain this" puts a creator on the defensive, while "We'd like your read before we use the row" gives them room to answer. If you wouldn't say a sentence on a first call, leave it out of the email.
A worksheet you can copy
Use one row per creator, and leave cells blank when you don't have the information. A blank is better than a guess.
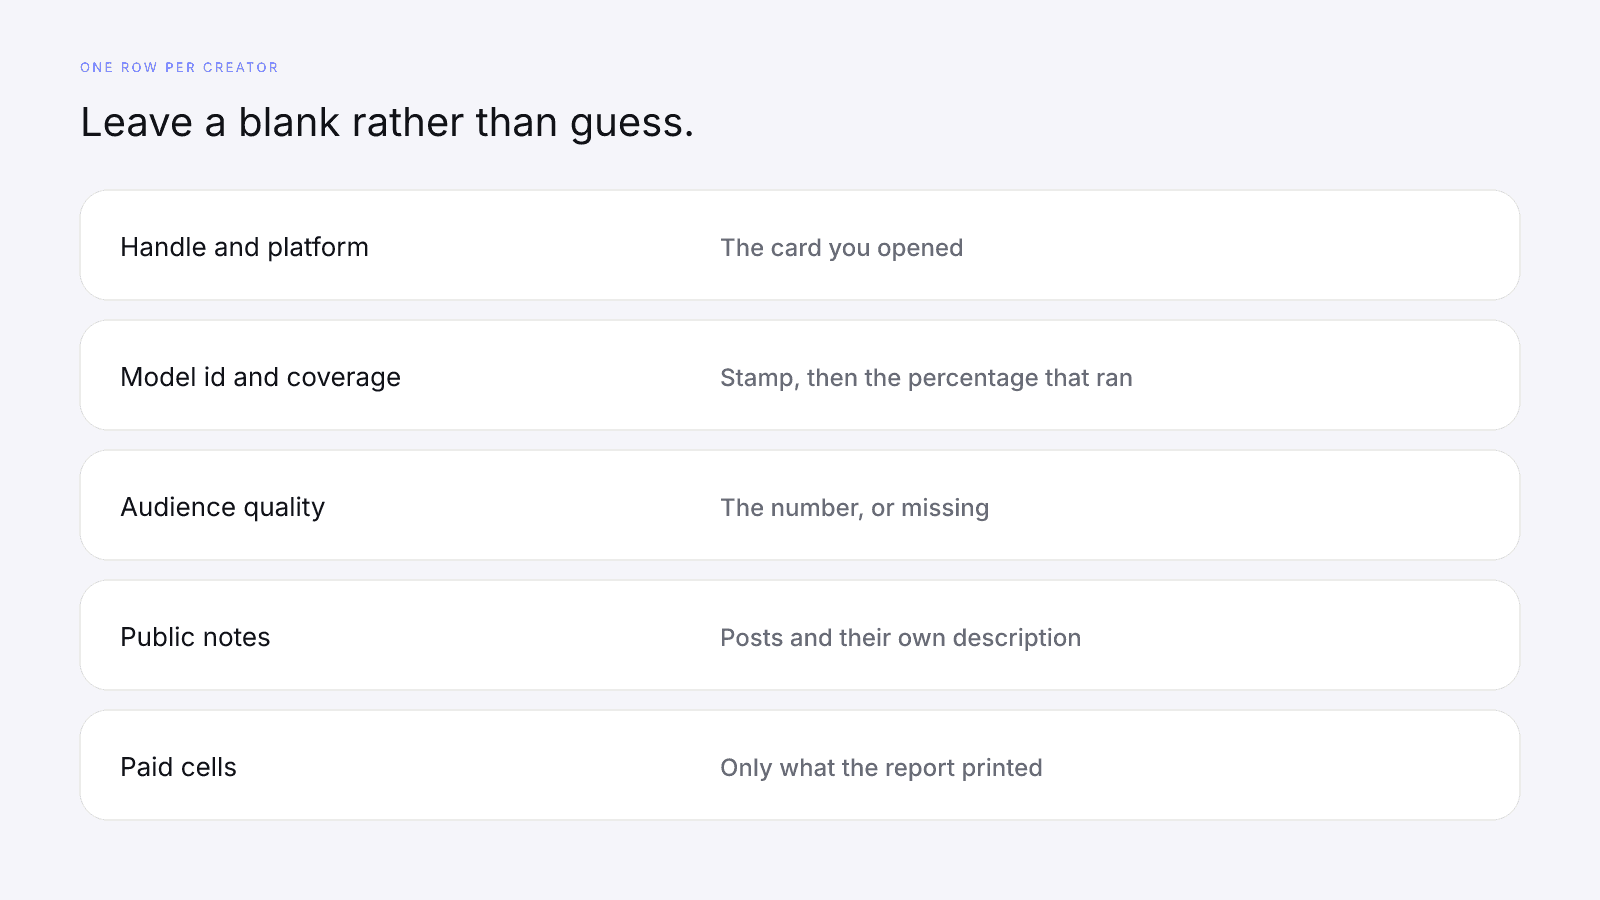
| Field | What to write |
|---|---|
| Handle and primary platform | The profile you searched, and the platform on the card |
| Model id | The stamp on the card. This guide expects 2026-08-18.1 |
| Scoring coverage | The coverage percentage on that fetch |
| Audience quality | The number, or "missing" if the row is a dash |
| Follower total | The figure on the card, if it printed one |
| Public notes | What you saw in recent posts and in their own description. No grade |
| Question sent | The question you actually asked |
| Their answer | Their words, short enough to be fair |
| Paid cells | Only if you opened the report. Followers, Likers, Commenters, each as printed or Unavailable. Note whether a credibility mix was present, and whether a credibility label was present |
If you didn't open the report, write "not opened" in the last row. Don't fill in Likers from memory. If a cell said Unavailable, write Unavailable. If there was a credibility label, copy its words from that report only. If there was a mix, just note that it was there, without naming the bars.
The 0–100 can go in the same file, but it shouldn't be the only line. On model 2026-08-18.1, audience quality is 32% of a full-coverage card, and the other rows measure other things. With a dash, the headline is a partial average, so write the coverage beside it. What Brands Should Read First on an InfScore Card has the reading order.
When audience quality shows a dash
A dash on audience quality means the provider didn't return a followers-credibility percentage for the primary platform on this fetch, so the 32% weight on model 2026-08-18.1 is held out. Scoring coverage is the sum of the weights that ran. When audience quality is the only missing row, coverage is 68, because 27 + 23 + 18 = 68. Missing Data on Creator Metrics applies the same hold-out to the other rows, giving coverage 73, 77, or 82 when a different single row is missing.
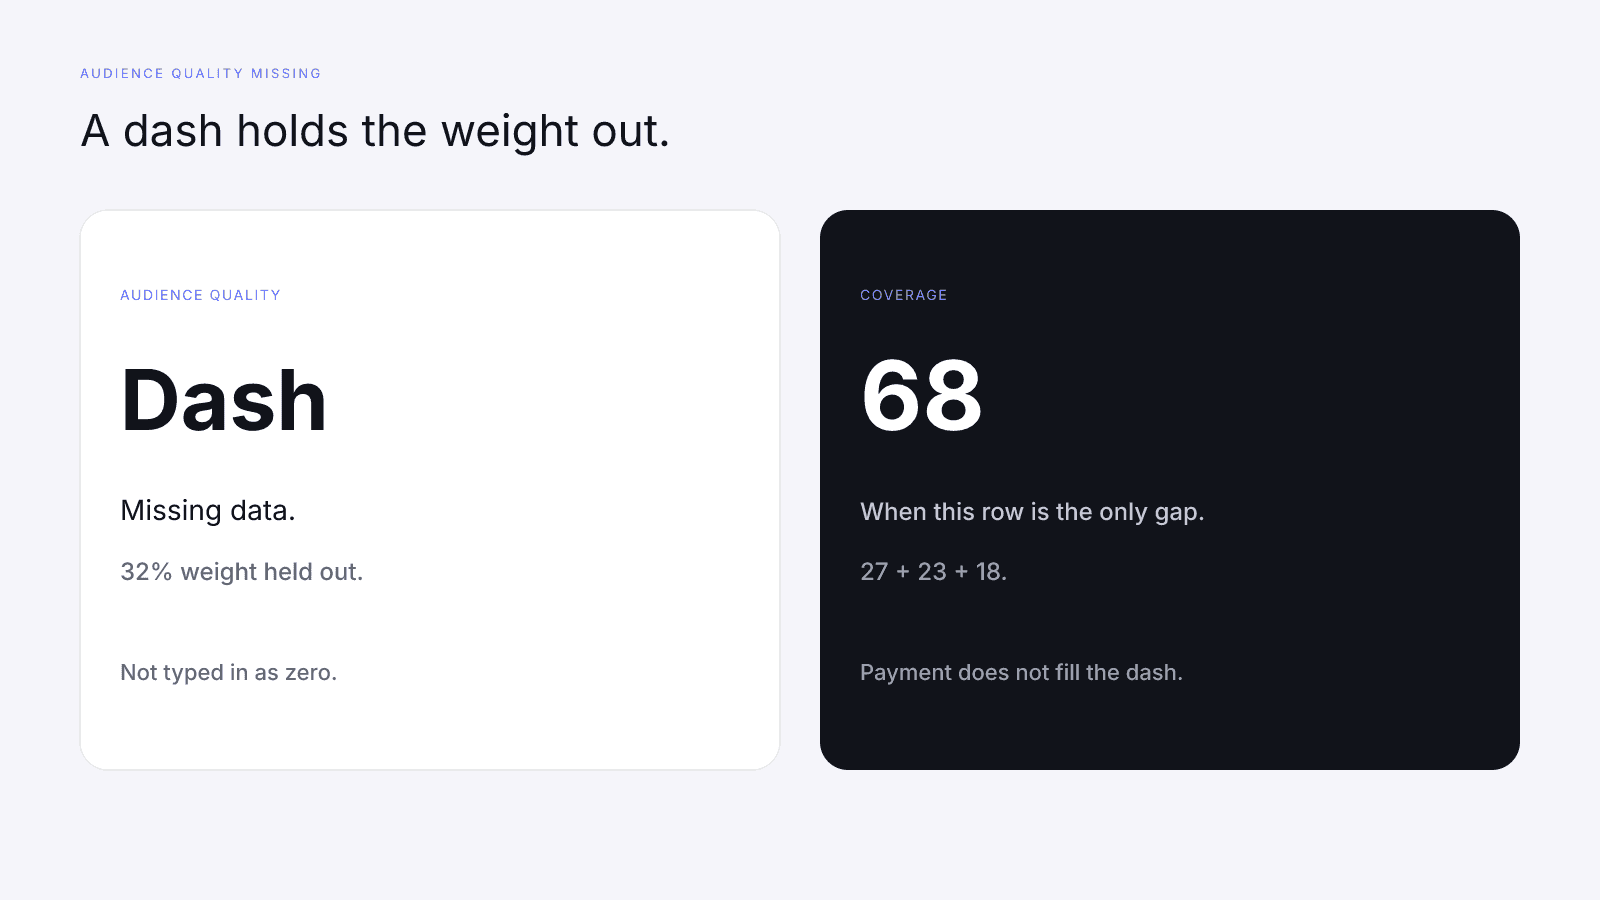
A dash on audience quality is missing data, not a red flag or a zero. Entering a zero and still dividing by 100 would penalize the profile for a gap, and the model doesn't do that. If a teammate reads the dash as a warning, show them the coverage line. Any rule stricter than "missing, weight held out" is the team's own rule and should be labeled that way. It isn't part of model 2026-08-18.1.
To practice, open a live card such as MrBeast on YouTube. Write down the model id, the coverage, and whether audience quality shows a number or a dash. A dash means the percentage was missing; it doesn't single the creator out, and a later fetch may return one. Only compare cards that share a model id. Comparing InfScore Across Model Versions covers that check. This page doesn't quote a score for that card.
Unavailable in the paid module is a different mark on a different surface. It means a report field wasn't returned. It doesn't turn a free-card dash into a number, and it doesn't mean the missing factor counted as zero.
Start with the free score
The free card is enough to start. Read the model id, the coverage, the audience-quality row, and the other three rows. Then decide whether your question is about that percentage, about a dash, or about something the card doesn't measure.
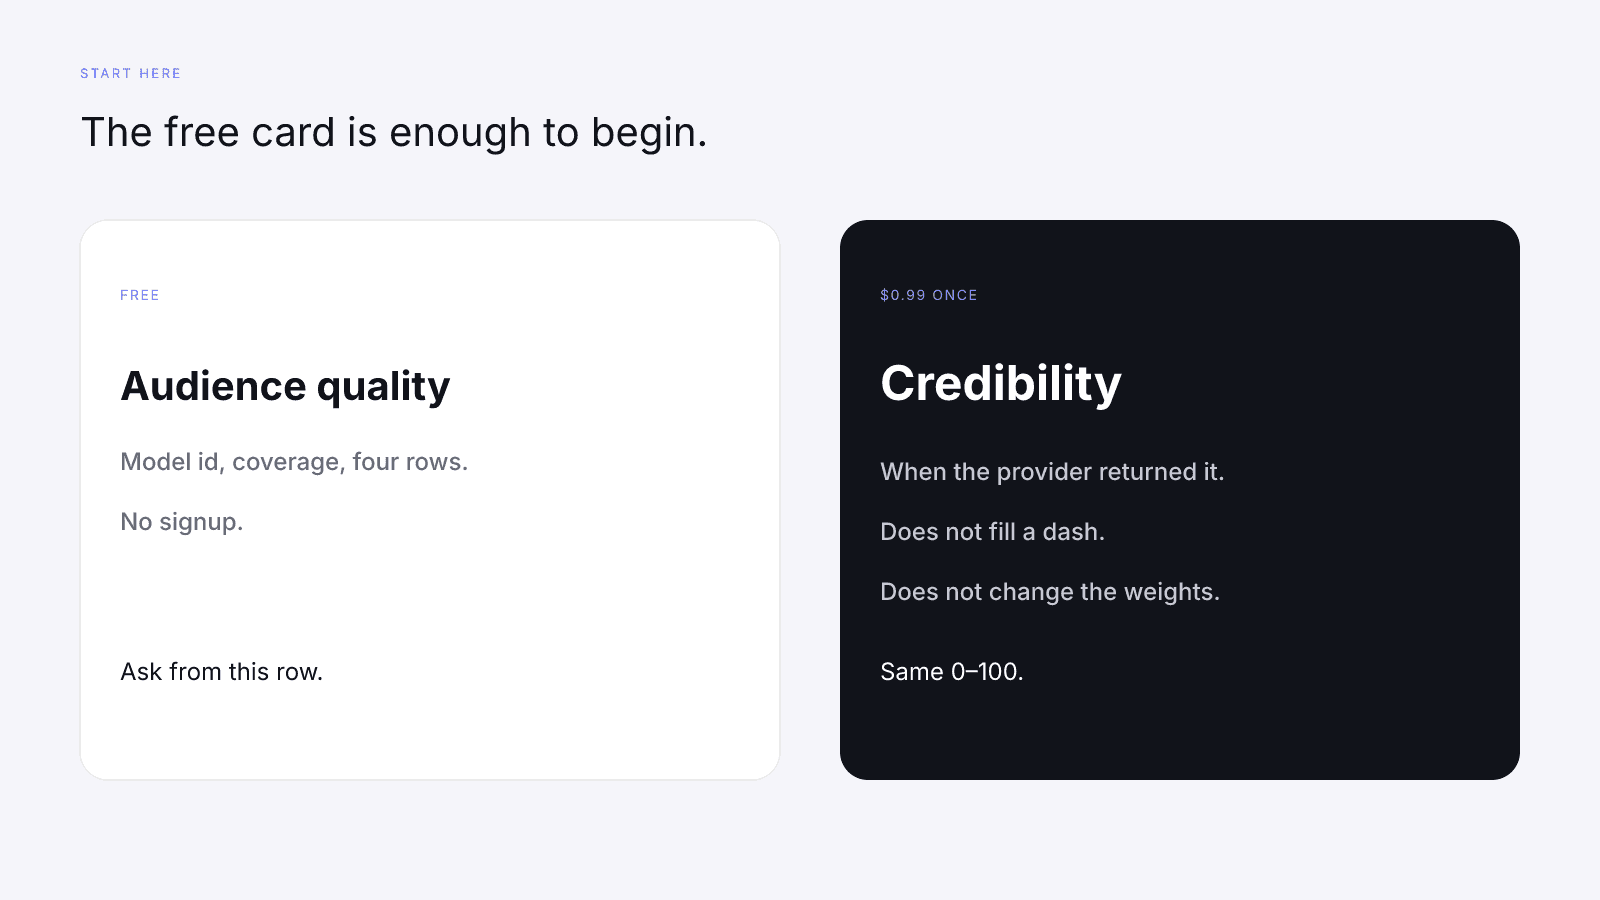
The full report is $0.99 once. Pricing is one report, not a subscription. It is the full creator report, with audience, growth, and platform deep dives when they exist. Credibility is one block in that report when the provider returned it. Paying does not change the 32/27/23/18 weights of model 2026-08-18.1, fill a dash, or raise a score.
Search a public Instagram, TikTok, or YouTube profile on infscore.com. Treat the audience-quality row as the credibility signal, and use a direct question for what no percentage can settle.
FAQ
How do you check if an influencer has fake followers?
Start with the free audience-quality row, then look at the public profile and ask the creator about their audience. On model 2026-08-18.1 that row is 32% of InfScore when it exists, and it is the provider-measured followers-credibility percentage for the primary platform. Engagement strength is 27%, reach and momentum is 23%, and platform strength is 18%. Read recent comments, compare follower changes with the posting history, and check that the audience the creator describes fits your brief. A low credibility reading is a reason to look closer, not proof. There is no score cutoff in this check.
Does InfScore detect fake followers?
No. InfScore is not a fraud detector. The free row shows a provider-measured followers-credibility percentage for the primary platform, or a dash when that percentage is missing. It does not name accounts and it does not prove a campaign result. Treat the number as a prompt to look closer and to ask the creator.
What does audience credibility mean?
On InfScore it is the provider-measured credibility percentage for the followers on the primary platform, the platform named on the card you searched. The card line reads "Provider-measured audience credibility when available." When that percentage comes back, it is the audience-quality factor, weighted 32% on model 2026-08-18.1. Follower count is a size figure on a different row.
Is a low credibility reading proof of bought followers?
No. A credibility percentage is one provider measure on one fetch. It does not list accounts or say how an audience was gained. Read coverage, the other three rows, and the public profile, then ask the creator for their read. InfScore publishes no cutoff that turns the percentage into a verdict.
Do Likers and Commenters credibility change the InfScore?
No. Likers and Commenters credibility are paid displays. They do not feed audience quality or the 0–100. The score uses the followers-credibility percentage for the primary platform only, and only when that percentage exists. A credibility mix and a credibility label do not move the weights either.
What does a dash on audience quality mean?
A dash on audience quality is missing data, not a red flag or a zero. The provider did not return a followers-credibility percentage for the primary platform on that fetch, so the 32% weight is held out. If that row is the only gap, scoring coverage is 68, because 27 + 23 + 18 = 68. Paying does not fill a dash.
What does the $0.99 report add?
The $0.99 report is a one-time unlock of the full creator report, with audience, growth, and platform deep dives when they exist, not a subscription. When audience data exists it includes a Credibility block with Followers, Likers, and Commenters, each a percentage or the word Unavailable, plus an optional credibility mix and an optional credibility label. Paying does not change the 32/27/23/18 weights on model 2026-08-18.1, fill a dash, or raise a score.