Micro vs Macro Influencers: What the Score Actually Rewards
Micro vs macro influencers: in InfScore, size only enters through reach (23%). Audience quality and engagement, 59% of the weights, don't reward size.
This versioned composite uses only available public signals. Missing factors stay unavailable and their weight is rebalanced across observed factors. It is not a percentile, price estimate, or guarantee of campaign results. Model 2026-08-18.1.
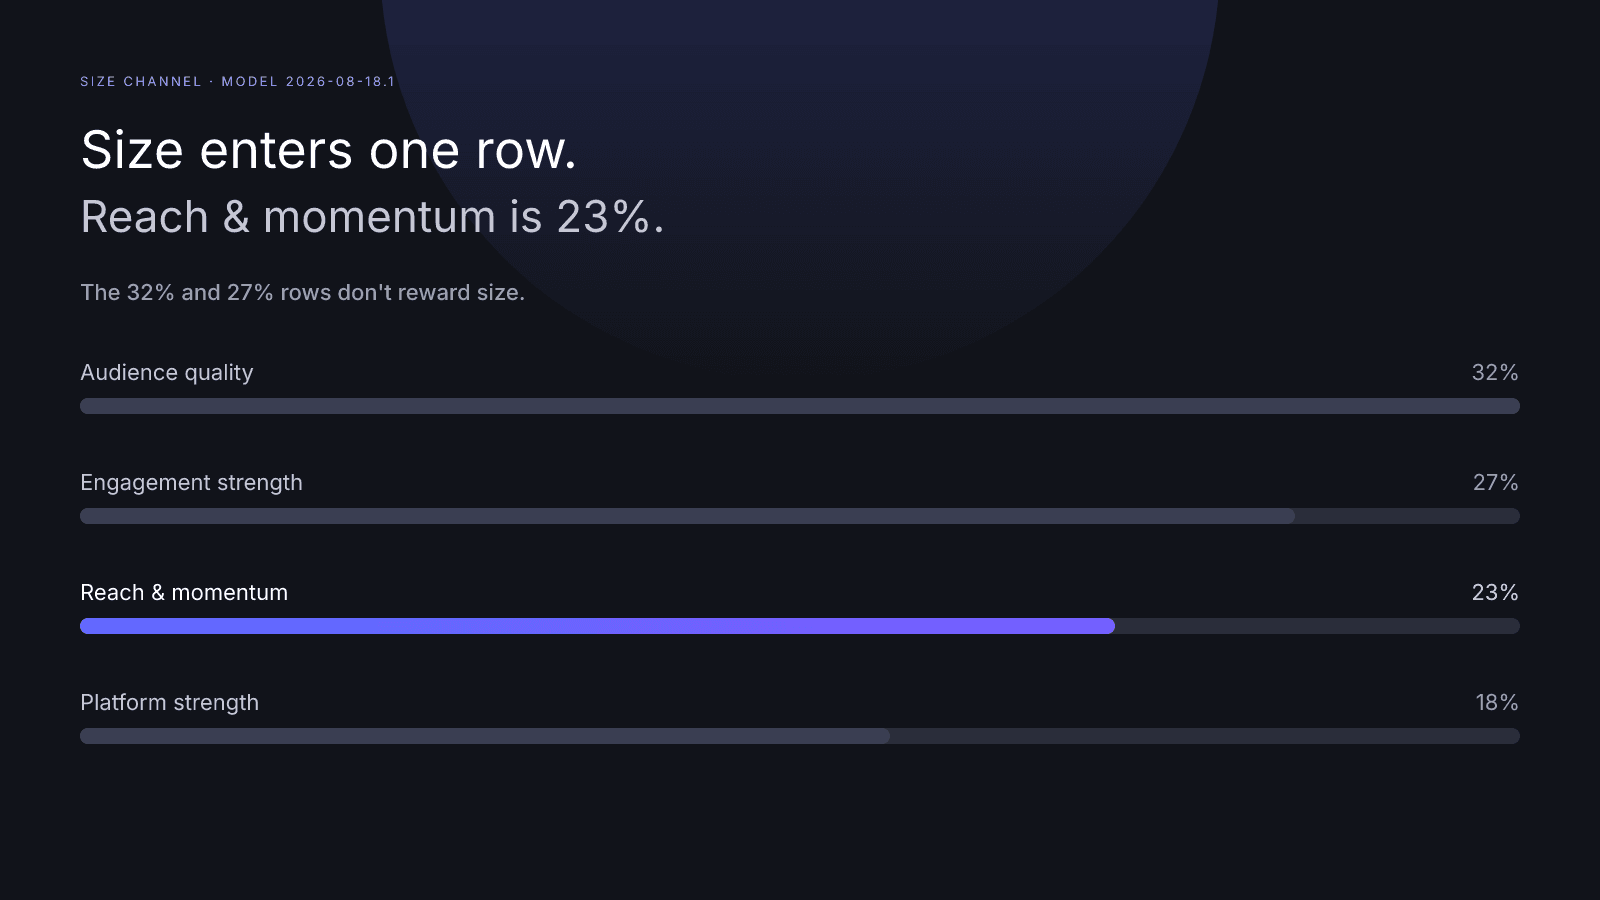
InfScore has no micro or macro bonus. Whichever side of the micro vs macro influencers split a creator sits on, follower count enters only one row, reach & momentum, on a log scale. On model 2026-08-18.1 the composite is audience quality 32%, engagement strength 27%, reach & momentum 23%, and platform strength 18%. Audience quality and engagement strength, 59% at full coverage, don't reward size, so a smaller creator can out-score a bigger one when those rows are stronger, and a bigger creator can out-score a smaller one on the same formula. If a signal is missing, the card shows a dash, which means not measured rather than zero, and that weight is held out.
The four-factor tour is How to Measure Influencer Performance. This page sticks to the size question.
The short answer
- Size enters the score in one place: the 23% reach & momentum row, on a log scale that runs from 0 at 1,000 followers to 100 at 100 million.
- At full coverage, each tenfold step in followers is worth at most 4.6 composite points, or 3.22 when growth is blended in.
- Audience quality (32%) and engagement strength (27%) are 59% of the weights at full coverage, and neither rewards size.
- A dash is missing data, not a zero.
What "micro" and "macro" mean
"Micro" and "macro" are common names for a smaller or larger public following. The tier ranges people quote are conventions, not a standard. InfScore does not publish a cutoff for either word, and it does not add a fifth factor called size class. Searching a profile does not ask which label you prefer. The free card prints a follower total when the provider returned one, then the four factor rows.
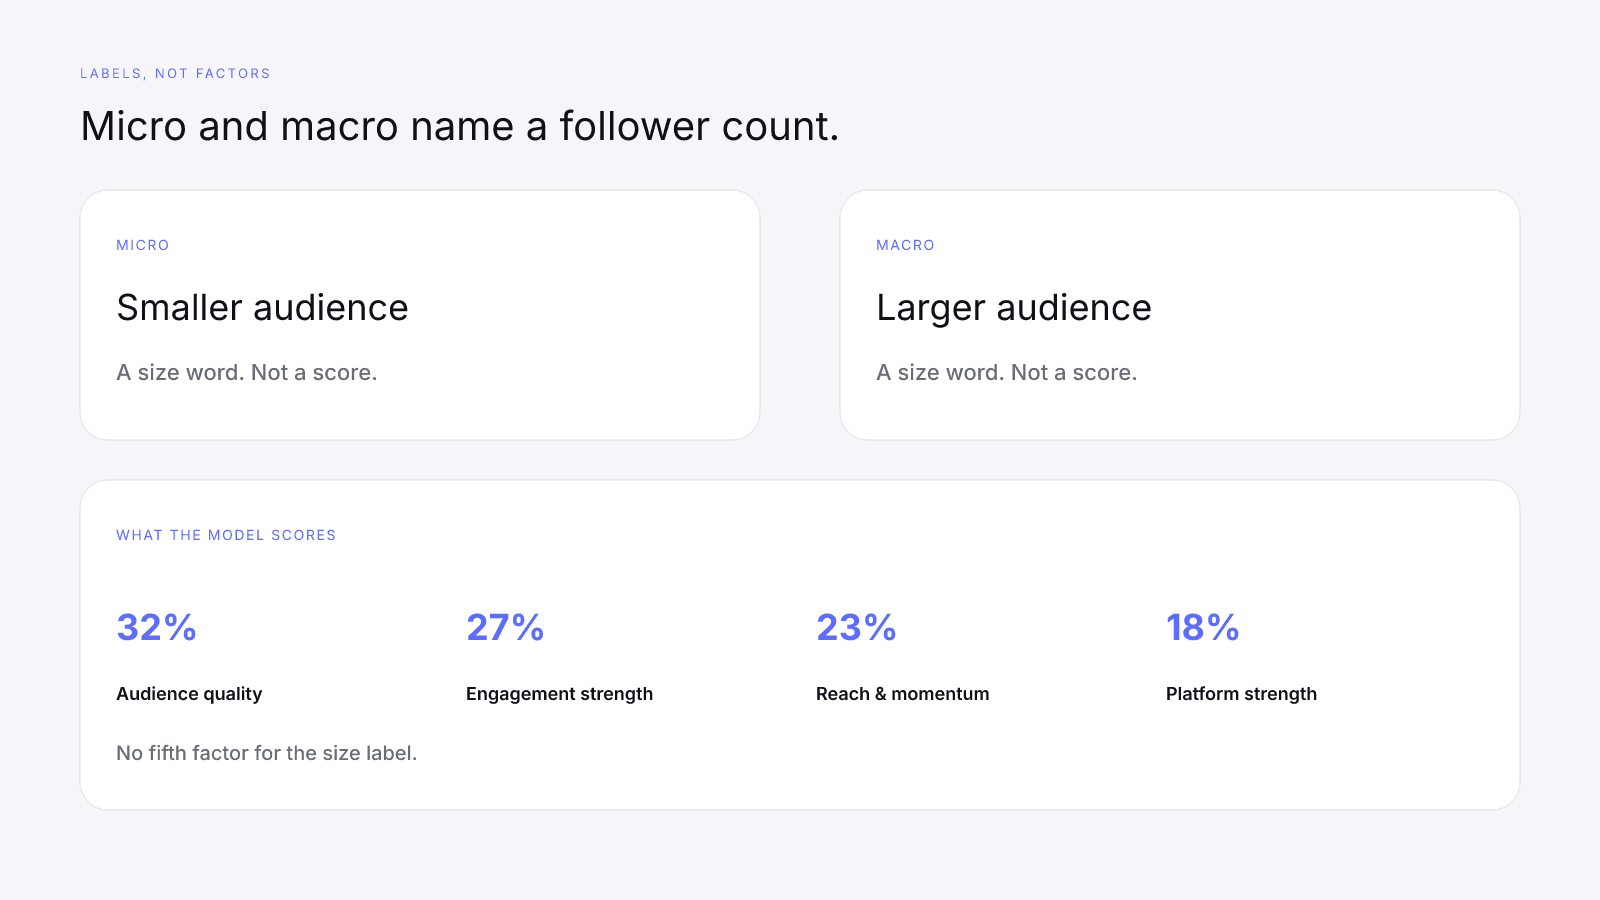
The tier next to the 0–100 is also not a size class. Elite is 90–100, Rising is 80–89, Emerging is 65–79, and Developing is below 65. Those bands describe the composite on the card you are holding. A large audience can sit in Developing. A smaller audience can sit in Emerging. Neither placement is a reward for the label.
The live score card states the same limit in product language: "Available factor weights are normalized when provider data is missing. It is not a percentile, price estimate, or guarantee of campaign results." A size label is a useful way to talk. It is a poor way to finish a reading.
Where size enters the score
Reach & momentum is 23% of model 2026-08-18.1 when that row exists. The reach piece is logarithmic:
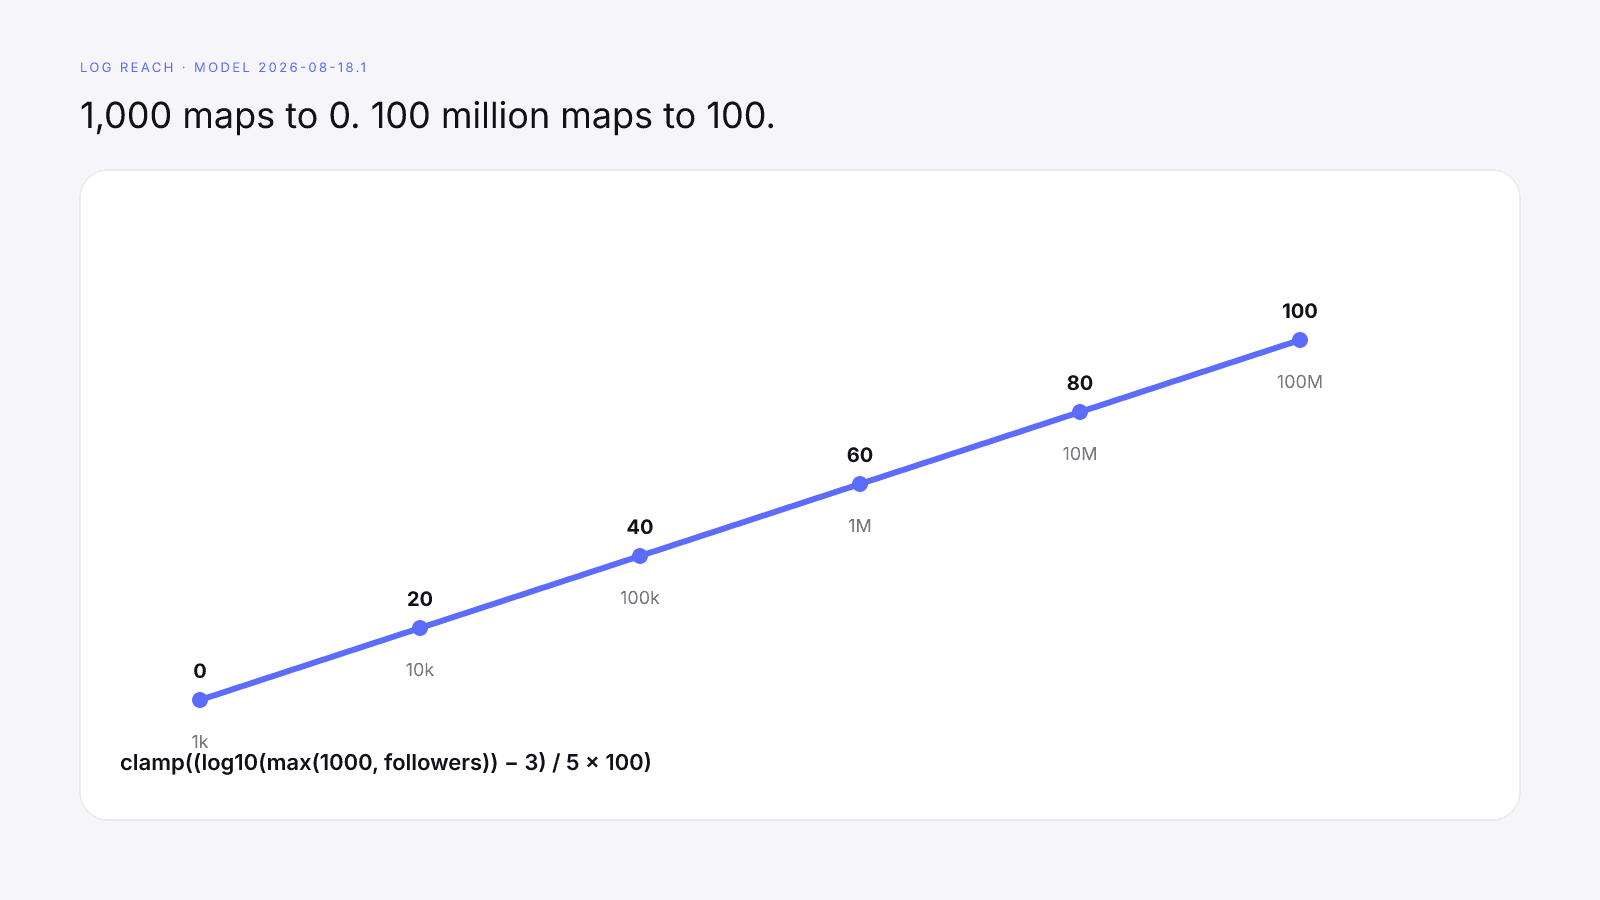
clamp((log10(max(1000, followers)) - 3) / 5 * 100)
One thousand followers maps to 0. One hundred million maps to 100. The max(1000, followers) term means a count under 1,000 does not fall below 0. The clamp means a count above 100 million does not rise above 100 on this piece. When a growth percentage exists, the row blends log reach 70/30 with momentum, covered below.
What the log scale does
Between 1,000 and 100 million followers, each tenfold increase adds 20 points to log reach:
| Public followers | Log reach |
|---|---|
| 1,000 | 0 |
| 10,000 | 20 |
| 100,000 | 40 |
| 1,000,000 | 60 |
| 10,000,000 | 80 |
| 100,000,000 | 100 |
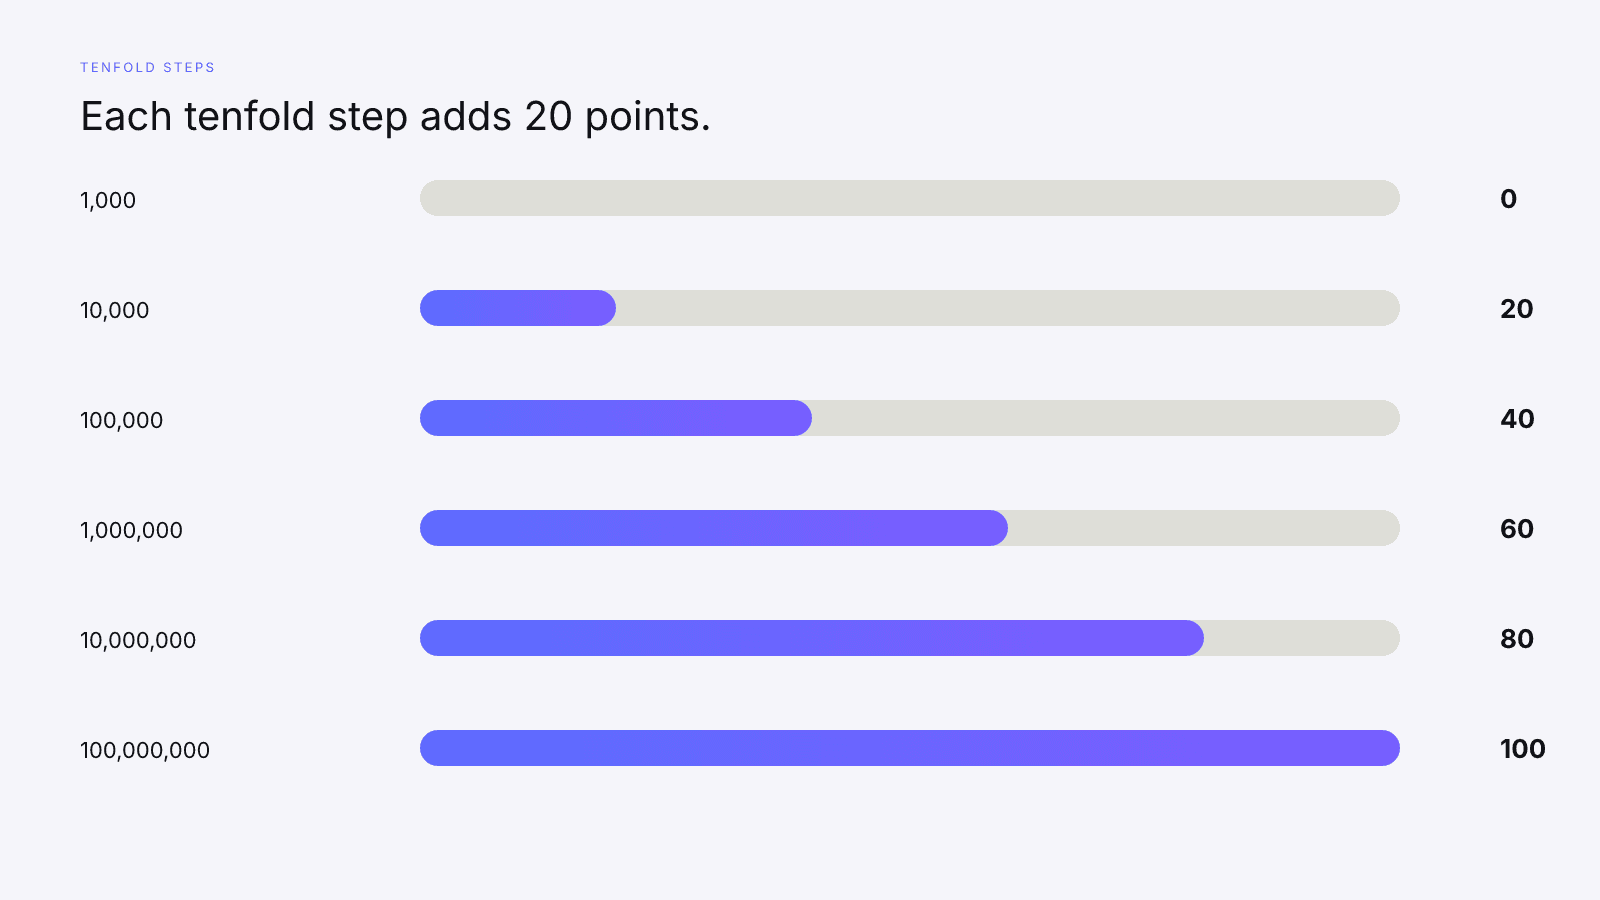
This is formula arithmetic, not a forecast. At full coverage, 20 points on a 23% row is worth at most 4.6 composite points (23% × 20). When growth is blended in, log reach carries 70% of the row, so the same tenfold step is worth 3.22 (23% × 20 × 0.7).
Read the table as the shape of one factor, not as a rate card. The step from 1,000 to 10,000 is 20 points. The step from 10 million to 100 million is also 20 points. A brand can still care more about the second step, but inside this row it isn't worth ten times the first. That compression is the formula, not a claim that the two audiences are interchangeable.
If the follower total is missing, or it is not a positive number, the reach row does not run. The factor is a dash, not a quiet zero, and you can't type the count in yourself.
When growth exists, the row is a 70/30 blend
Log reach is the whole row only when no growth percentage came back. When a growth percentage exists, momentum takes 30% and log reach keeps 70%. Momentum is clamp(50 + growthPercent * 2), and the row is the rounded blend.
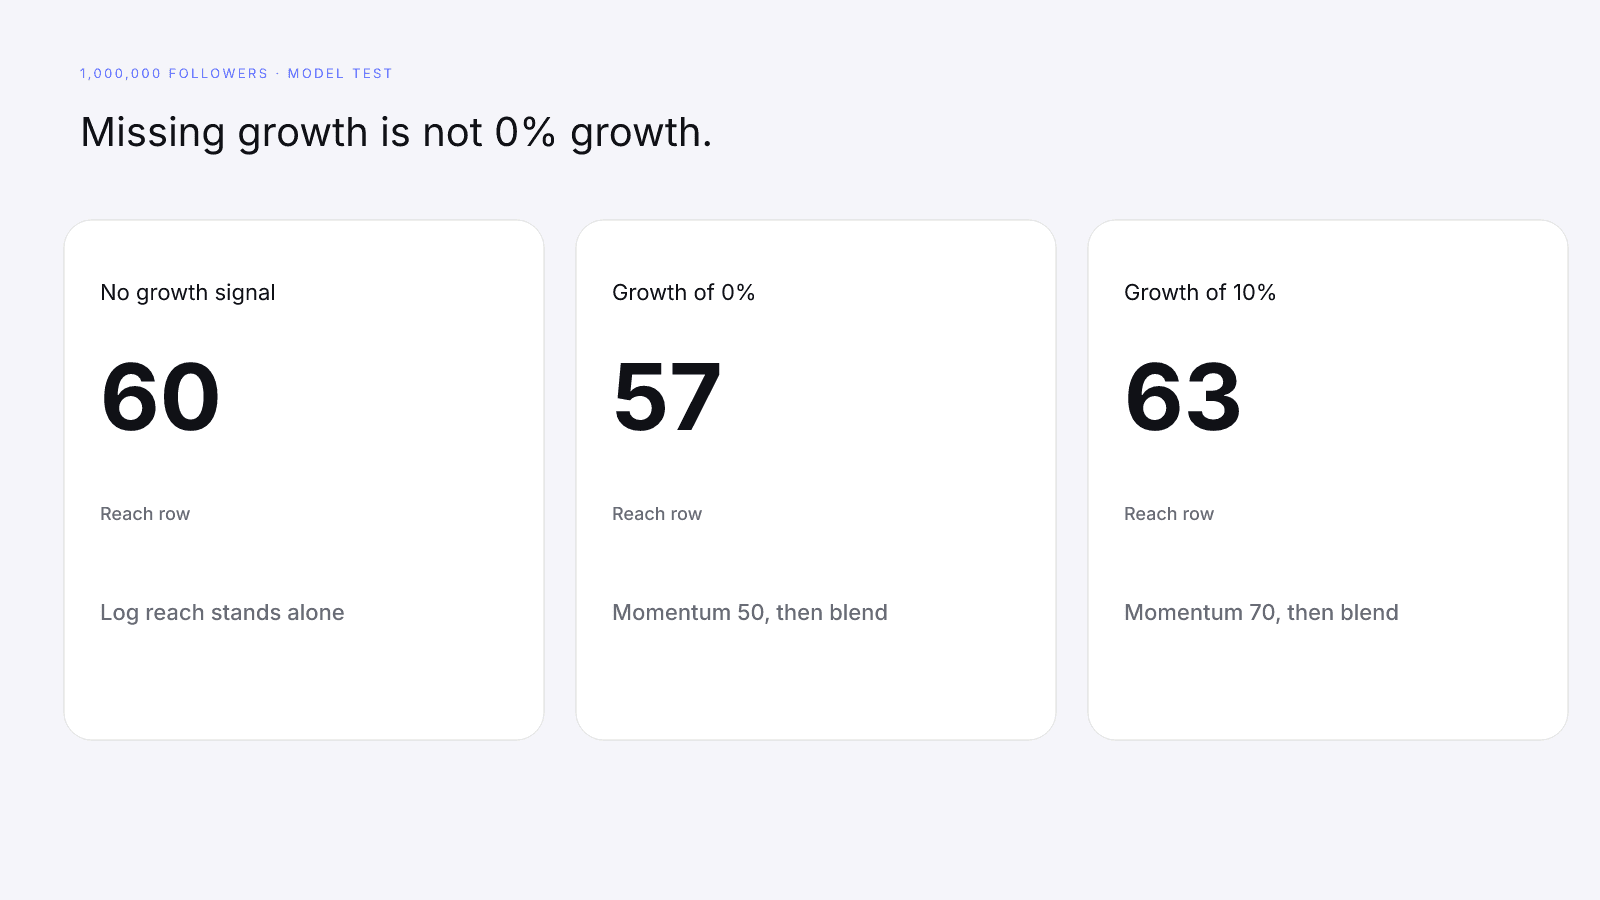
On a clean million followers, log reach is 60. The same audience then prints different reach rows depending on the growth signal:
- No growth signal: the row stays 60.
- Growth of 0: momentum is 50, and the blend rounds to 57.
- Growth of 10: momentum is 70, and the blend rounds to 63.
- Growth of 25: momentum is 100, and the blend rounds to 72.
- Growth of −10: momentum is 30, and the blend rounds to 51.
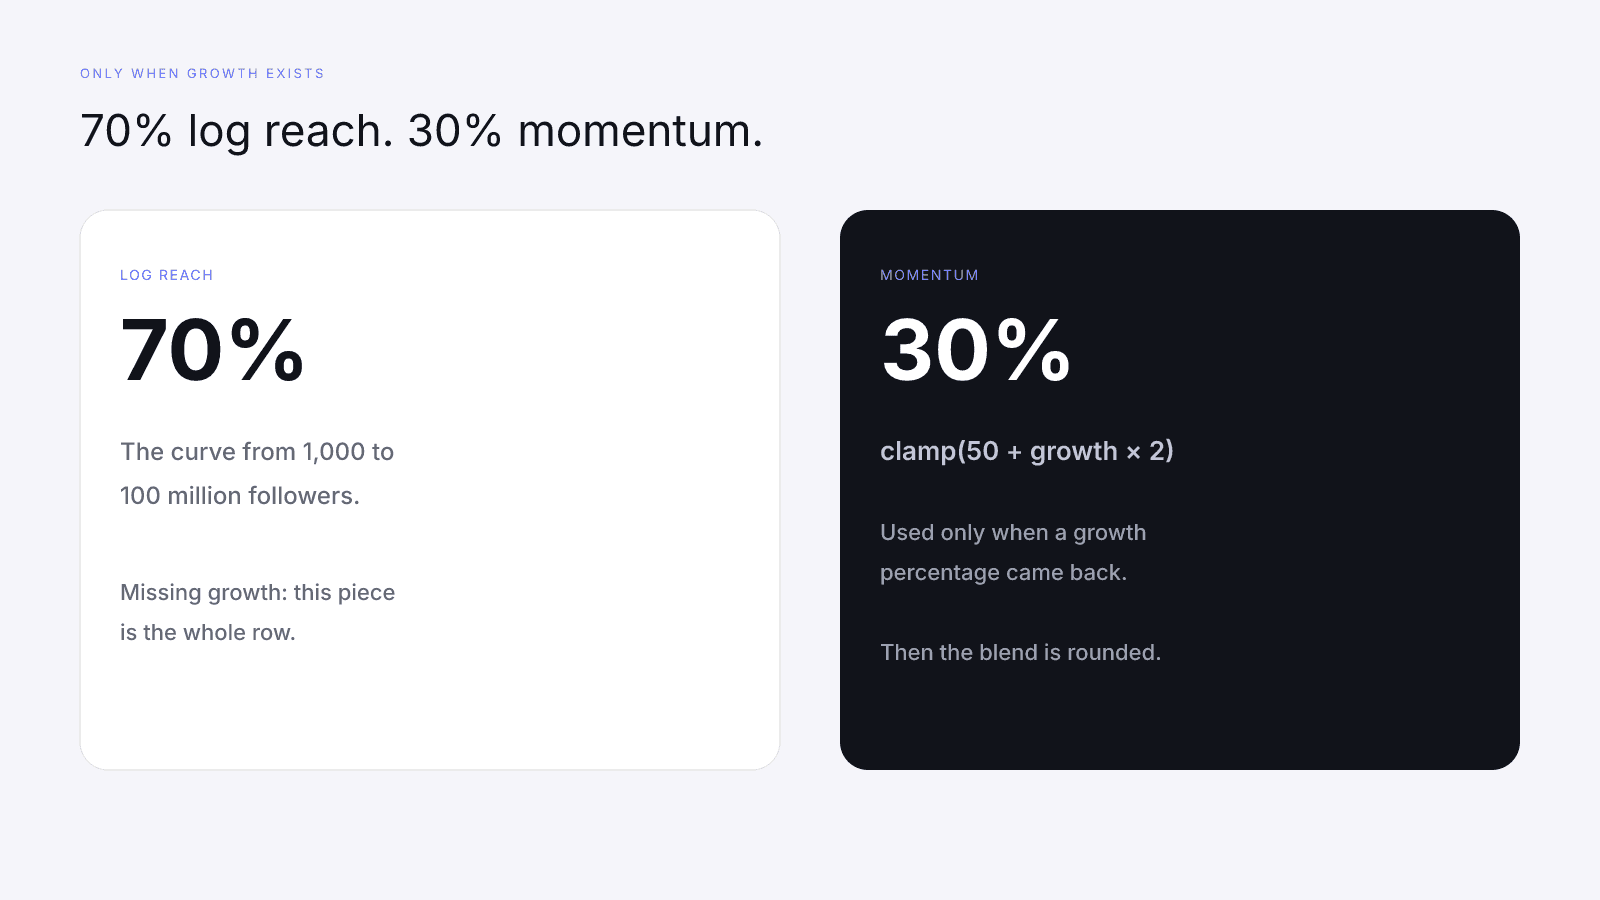
A missing growth signal is not a dash on this row, and it is not the same event as 0% growth. Zero percent growth is a real input. It pulls the blend. A missing input leaves the log reach alone. At 100 million followers the log piece is already 100. With no growth signal the row stays 100. With 10% growth, momentum is 70 and the blend is 91. The top of the log curve is not a promise that every very large account prints 100 on the factor.
A checkable case from the model tests, not a live creator, uses 1,100,000 followers and a growth percentage of 10. Log reach is about 60.83. Momentum is 50 + 20 = 70. The blend is 0.7 × 60.83 + 0.3 × 70, about 63.58, and the row rounds to 64. Audience credibility of 0.8 becomes 80. A 4% public engagement rate becomes 50 on the fixed 0–8% scale. Two observed audiences produce a platform-strength score of 75. Coverage is 100. The composite is (80 × 32 + 50 × 27 + 64 × 23 + 75 × 18) / 100 = 6732 / 100 = 67.32, which rounds to 67. The 64 on reach is not the InfScore. The follower total is not the InfScore either.
What size doesn't buy
Audience quality (32%) and Engagement strength (27%) make up 59% of a full-coverage card, and neither rewards size. Follower count isn't an input to Audience quality or Engagement strength. At full coverage, reach at a perfect 100 contributes 23 points. It can't supply the other 77.
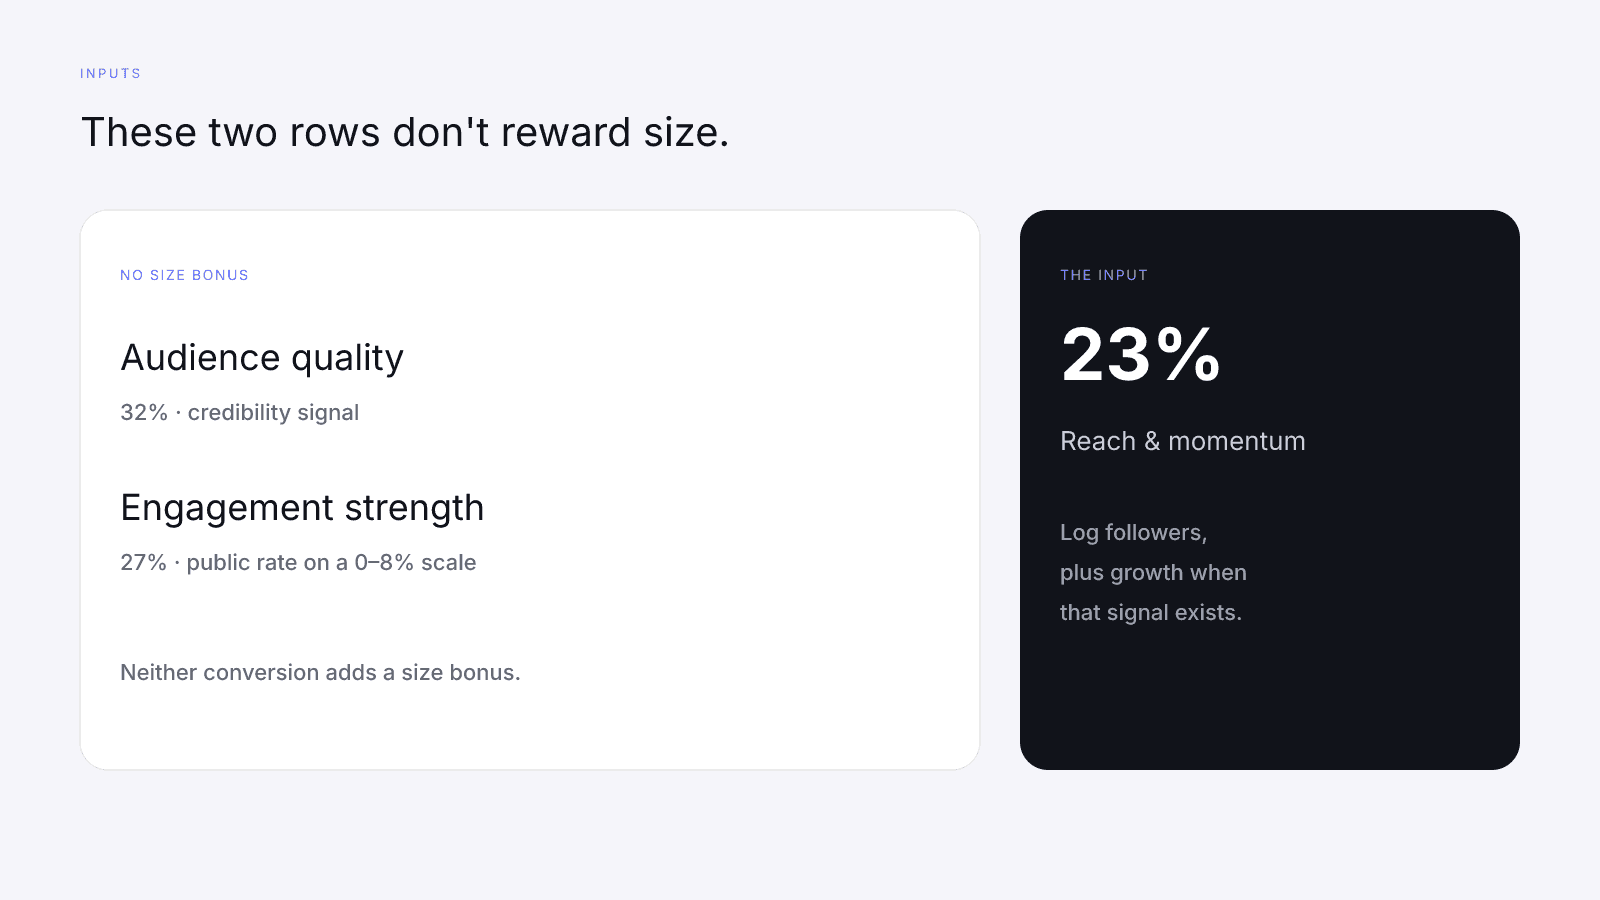
Audience quality is the provider's follower-audience credibility on the card's platform, when that public signal exists. If the provider sends 0.8 on a 0–1 scale, the factor is 80. If the field is missing, the factor is a dash. The follower total isn't part of that conversion, so a large count doesn't raise the row and a small one doesn't lower it. The credibility signal can still be weak on a large audience or strong on a small one. That is a property of the signal, which is Audience Quality vs Follower Count.
Engagement strength maps the provider-reported public engagement rate onto a fixed 0–8% scale. That rate may itself be computed per follower, so the count can sit in its denominator, but the score adds no size bonus on top. The math is the rate divided by 8, times 100, then capped. A 4% rate maps to 50. A 2% rate maps to 25. A 6% rate maps to 75. A rate above 8% stays at 100. The scale doesn't reward size: it doesn't change with audience size, and it doesn't publish a separate "good rate" for a smaller audience or a larger one. How to read that scale is What a Good Engagement Rate Looks Like in 2026.
A strong reach row cannot lend points to a weak engagement row. A strong engagement row cannot fill a dashed audience-quality row. Each factor uses its own inputs. The composite mixes the rows that returned a number.
Platform strength is the remaining 18%. Its floors are 45 for one observed public audience, 70 for two, and 90 for three or more, plus a small balance term from how follower share is split. The floor counts audiences. It does not read the magnitude that the reach formula reads. An empty second profile does not collect the two-audience floor. That row is Cross-Platform Creators.
A smaller creator can out-score a bigger one
The tests below are round inputs on model 2026-08-18.1, with no growth signal and one observed audience, so platform strength is 45 on every card and coverage is 100. They are not people, and they are not a campaign.
Larger test. Followers: 1,000,000, so log reach is 60. Audience quality: 40. Public rate: 2%, so engagement strength is 25. Platform strength: 45.
(40 × 32 + 25 × 27 + 60 × 23 + 45 × 18) / 100 = 4145 / 100 = 41.45, which rounds to 41.
Smaller test. Followers: 10,000, so log reach is 20. Audience quality: 80. Public rate: 6%, so engagement strength is 75. Platform strength: 45.
(80 × 32 + 75 × 27 + 20 × 23 + 45 × 18) / 100 = 5855 / 100 = 58.55, which rounds to 59.
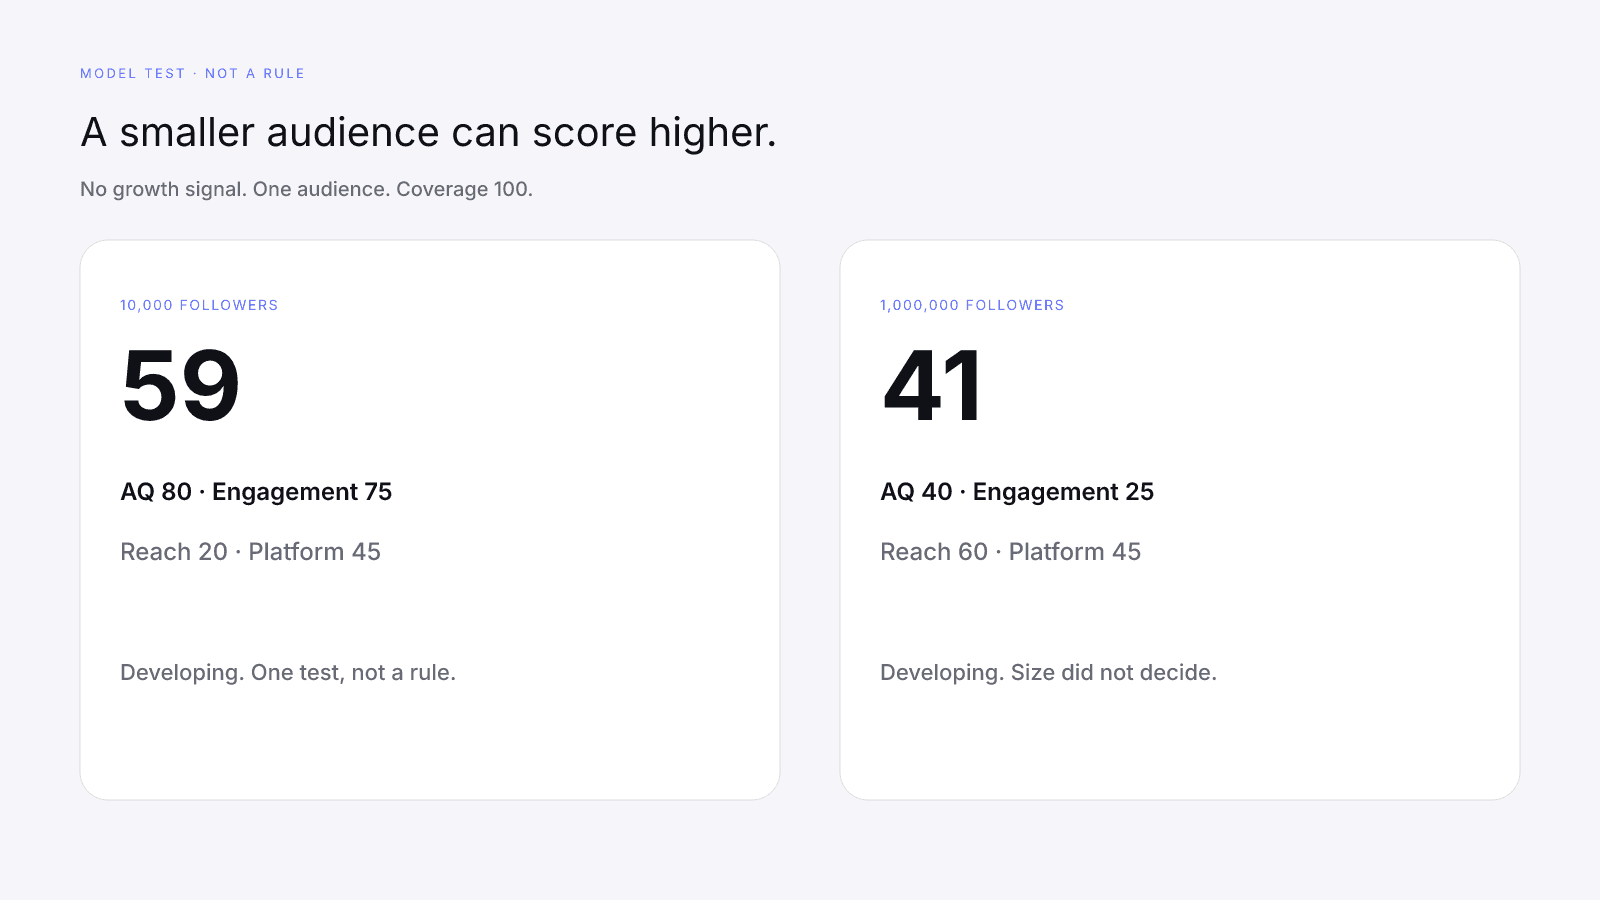
The smaller test out-scores the larger one, 59 to 41. Both land in Developing, which is the band below 65. Reach contributed 13.8 points on the larger test (60 × 23 / 100) and 4.6 points on the smaller test. The rest of the gap is audience quality and engagement strength. That is one worked pair. It is not a rule that smaller audiences score higher.
The reverse pair uses the same formula.
Larger test, stronger heavy rows. Followers: 1,000,000. Audience quality: 85. Public rate: 4%, so engagement strength is 50. Reach: 60. Platform strength: 45.
(85 × 32 + 50 × 27 + 60 × 23 + 45 × 18) / 100 = 6260 / 100 = 62.6, which rounds to 63.
Smaller test, weaker heavy rows. Followers: 10,000. Audience quality: 30. Public rate: 1.6%, so engagement strength is 20. Reach: 20. Platform strength: 45.
(30 × 32 + 20 × 27 + 20 × 23 + 45 × 18) / 100 = 2770 / 100 = 27.7, which rounds to 28.
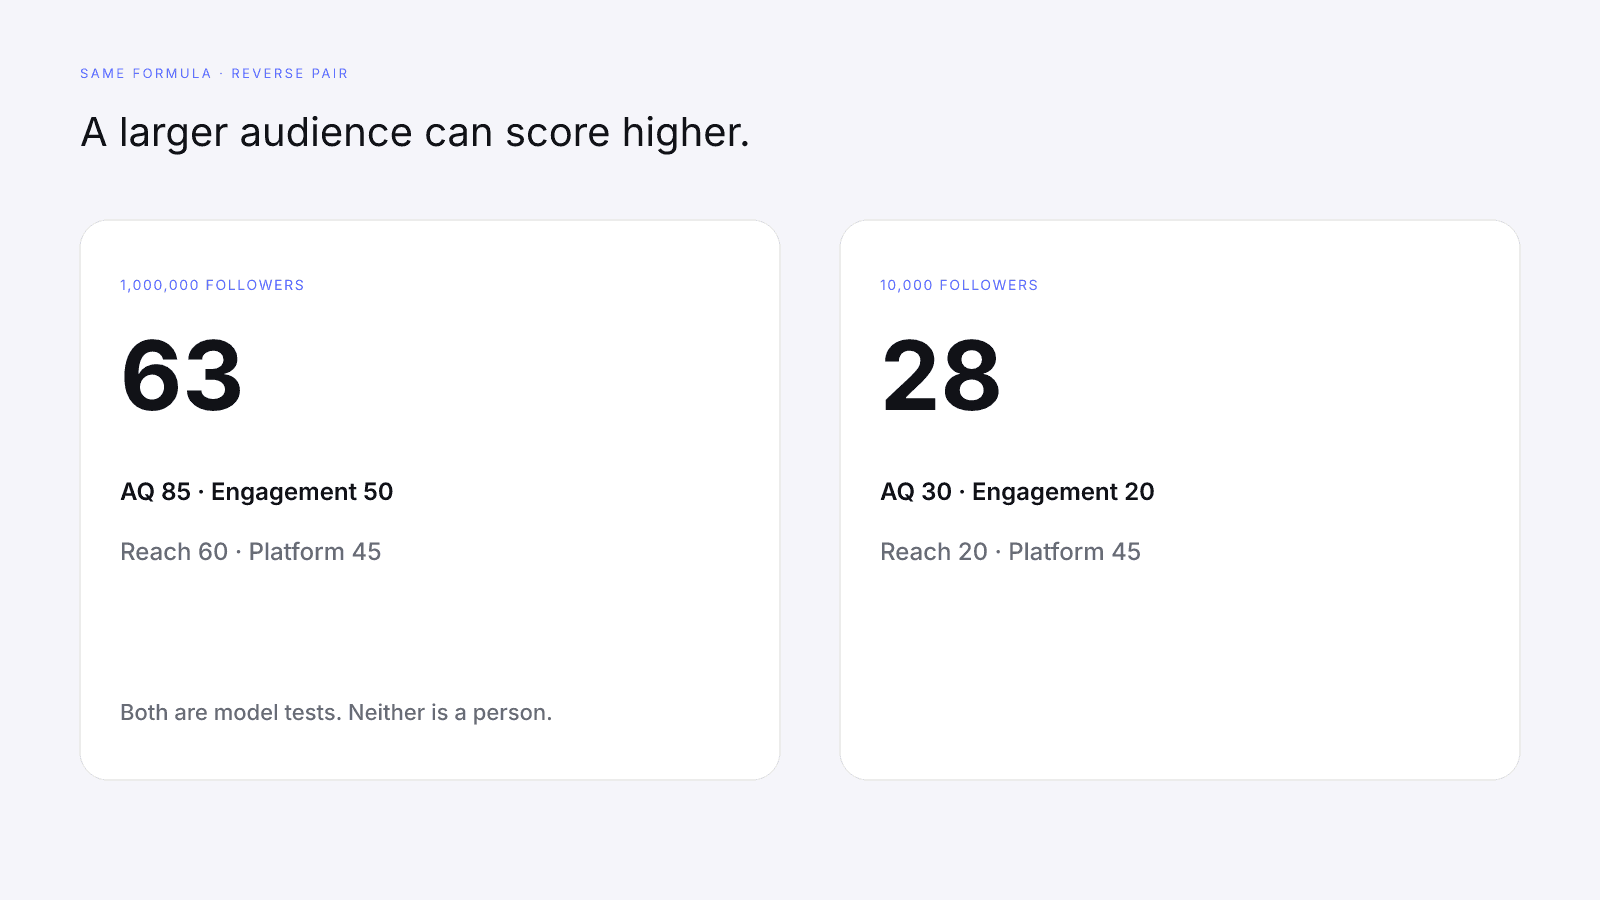
Here the larger test wins, with the same weights and the same coverage. In neither pair did the follower total pick the winner; the rows did.
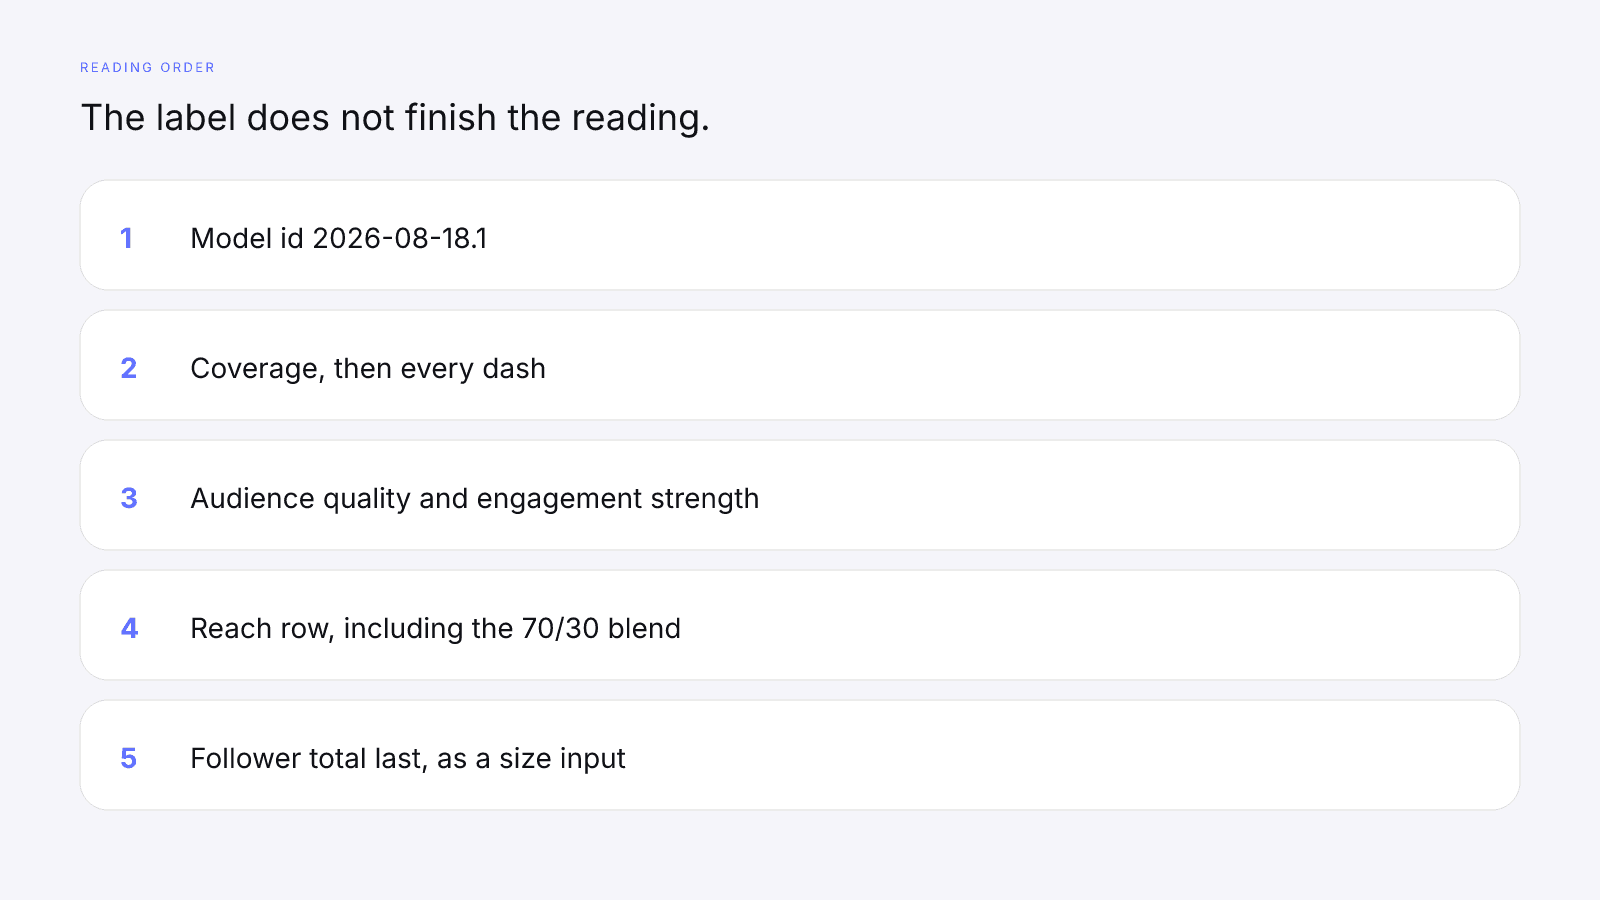
Do not paste 59, 41, 63, or 28 next to a live profile and subtract. When you compare two real cards, match the model id and the platform surface, then read coverage and dashes before the headline. That order is Comparing Two Creators Fairly With InfScore. A large audience with weak audience quality and weak engagement is a different reading, covered in Why High Follower Counts Still Score Low.
A dash is a gap in the comparison
Take the first larger test and remove audience quality. Engagement stays 25, reach stays 60, platform strength stays 45. Coverage falls to 68, because 27 + 23 + 18 = 68. The composite is (25 × 27 + 60 × 23 + 45 × 18) / 68 = 2865 / 68 = 42.13, which rounds to 42.
The headline moved from 41 to 42 because a scored 40 left the average. The audience didn't improve; the evidence got thinner. Typing a zero into the missing cell and still dividing by 100 gives 28.65, which rounds to 29. The model does not apply that penalty.
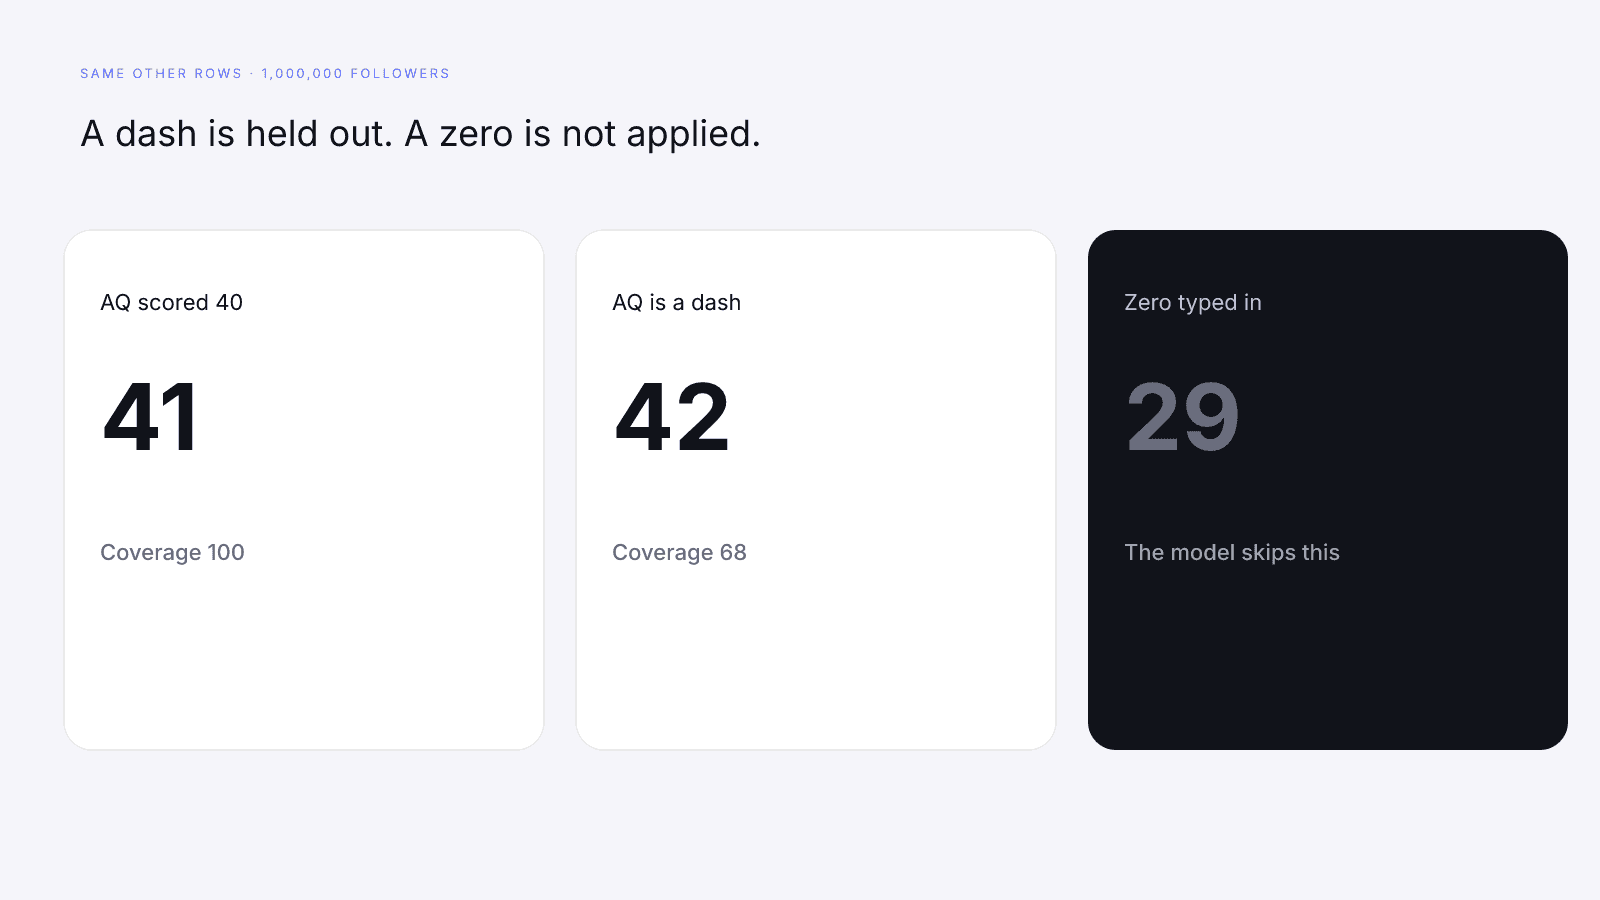
One missing factor changes the denominator in a fixed way. Audience quality dashed: coverage 68. Engagement dashed: coverage 73 (32 + 23 + 18). Reach & momentum dashed: coverage 77 (32 + 27 + 18). Platform strength dashed: coverage 82 (32 + 27 + 23). The longer arithmetic is Missing Data on Creator Metrics.
A dash on reach is the case where you cannot use InfScore as a size comparison at all. The follower total was missing or not usable, so the only row that takes that count did not run. Name the gap. Do not invent the log score from a screenshot you trust more than the card.
Two headlines with different coverage are not the same kind of average. A 59 with coverage 100 and a 59 with coverage 68 do not say the same thing, even if both accounts look "small" or both look "big" in a spreadsheet.
Live reading: four public cards
We re-checked four public score pages on 9 October 2026 at about 09:11 Sofia time. They're listed alphabetically by handle. This is a reading of the reach row on each card, not a ranking, and any value can change on a later fetch.
| Card | InfScore | Band | Coverage | Total public followers | Reach & momentum |
|---|---|---|---|---|---|
| @cristiano, Instagram | 57 | Developing | 100 | 679.5M | 100 |
| @emmachamberlain, Instagram | 67 | Emerging | 100 | 14M | 83 |
| @khaby.lame, TikTok | 87 | Rising | 68 | 163M | 85 |
| @mrbeast, YouTube | 69 | Emerging | 68 | 745.3M | 100 |
The @emmachamberlain row is one you can check by hand. log10(14,000,000) is about 7.15, and (7.15 − 3) / 5 × 100 is about 82.9, which rounds to the 83 on the card. The card prints a rounded 14M, so treat that as a consistency check, not an exact recomputation.
The other three follower totals are above 100 million, so the log piece is at its clamp of 100 on each. The @cristiano and @mrbeast cards print 100 on the row. The @khaby.lame card prints 85, so that row isn't the log piece alone. This page doesn't work a growth number back out of the 85; the printed row is the figure to cite.
The TikTok and YouTube cards show a dash on audience quality, which is why their coverage reads 68. That dash is missing data, not a zero. On every card, the follower total reaches the headline only through the 23% row, and the rest comes from the other rows.
What this means for brands and creators
Sort the shortlist by the rows, not by the nickname.
- Write down the model id. This version is
2026-08-18.1. A different stamp is a different formula, not growth. - Write down scoring coverage and name every dash.
- Read audience quality and engagement strength before reach. Neither rewards size.
- Read the follower total as the input to the log curve, including the 70/30 blend if a growth percentage exists.
- If you are choosing between two creators, keep the surface and the model id matched. The larger audience does not break a tie.
InfScore is not a percentile, a rate card, a price, or a guarantee of campaign results. It will not tell a brand to book the smaller account, and it will not tell a brand to book the larger one. The 0–100 is the rebalanced mix of the rows that exist.
Creators run into the same thing from the other side. In the formula, added followers reach the score only through the capped 23% reach factor, at 20 log points per tenfold step until the clamp at 100 million. They can't buy audience quality or engagement strength, and a per-follower engagement rate can fall when the count grows without more interactions. Comment pods are the wrong lever on the 27% row. The public-signal path, without a promised point total, is Ethical Ways to Improve Your InfScore. Re-check a later fetch under the same model id, and read the rows, not just the new headline.
Start with the free score
The free InfScore needs no signup. The card shows the 0–100, the tier, the four rows, scoring coverage, the follower total when it exists, and the model id. That is enough to see whether size is doing the work you think it is doing.
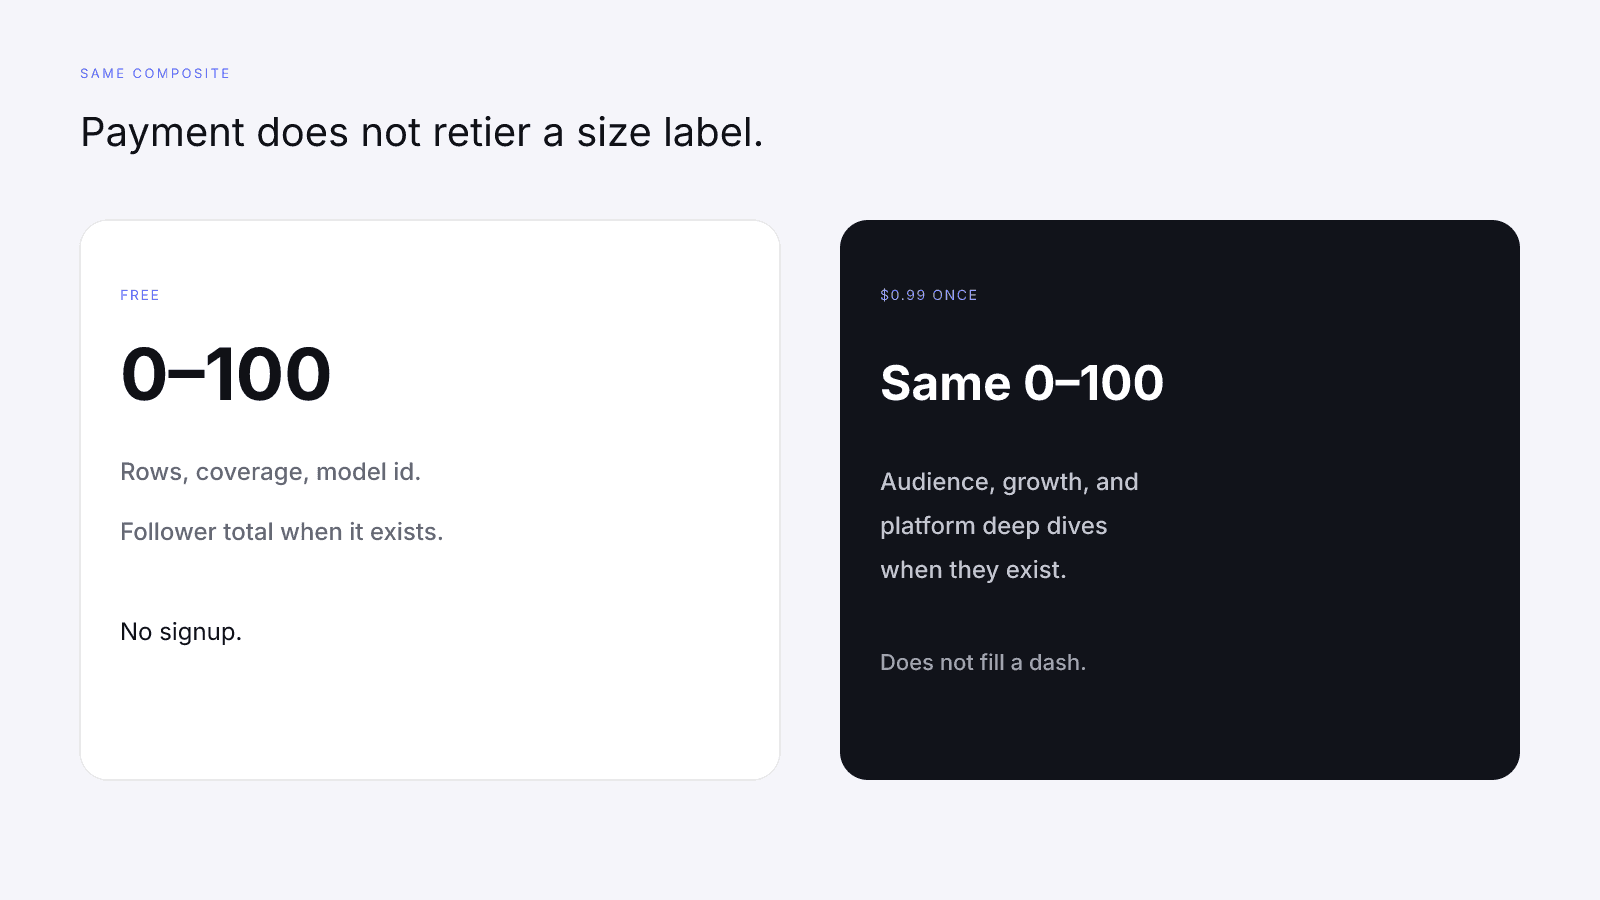
The full report is $0.99 once. Pricing is one report, not a subscription. It is the full creator report, with audience, growth, and platform deep dives when they exist. The paid growth series can show how a follower count moved. It does not rewrite the 23% row, and it does not assign a micro or macro class.
Paying does not change the 32/27/23/18 weights, fill a dash, or raise a score.
Search a public Instagram, TikTok, or YouTube profile on infscore.com and read the reach row beside audience quality and engagement strength. Homepage tiles are illustrative; a score URL is the real card.
On this versioned model, size only counts through the log reach row: 23% when it runs, blended 70/30 with growth when growth exists. Everything else comes from other public signals, so read those before the label.
FAQ
What does micro vs macro influencers mean on InfScore?
The words are size labels for a follower count. InfScore does not publish a micro band or a macro band, and it does not add points for wearing either label. On model 2026-08-18.1 the weights are audience quality 32%, engagement strength 27%, reach and momentum 23%, and platform strength 18%. Follower count enters the log reach formula inside that 23% row. Audience quality and Engagement strength don't reward size.
How does the reach formula treat follower count?
On model 2026-08-18.1, log reach is clamp((log10(max(1000, followers)) - 3) / 5 * 100). One thousand followers maps to 0. One hundred million maps to 100. Counts under 1,000 stay at 0. Counts above 100 million stay at 100 on that piece. When a growth percentage exists, the row is 70% log reach and 30% momentum. Momentum is clamp(50 + growthPercent * 2). If growth is missing and followers exist, the row is the log reach alone.
Can a smaller creator out-score a bigger one?
Yes, it can happen. A model test with round inputs, not a real creator, and no growth signal, scores a 10,000-follower profile at 59 and a 1,000,000-follower profile at 41, because the smaller test has stronger audience quality and engagement strength. A second test on the same formula reverses the gap, 63 against 28. Smaller audiences do not score higher as a rule. Read the rows, the coverage, and the model id.
Does a dash on a factor count as zero?
No. A dash is missing data, not a zero. The weight is held out and the remaining weights are rebalanced. If audience quality is the only gap, coverage is 68. Engagement missing leaves 73, reach and momentum missing leaves 77, and platform strength missing leaves 82. On the larger model test, holding a scored audience-quality row out moves the composite from 41 to 42. Writing a zero into that cell and dividing by 100 would round to 29. The model does not apply that penalty.
Does the $0.99 report change a micro or macro score?
No. The free InfScore needs no signup. The $0.99 report is a one-time unlock of the full creator report, with audience, growth, and platform deep dives when they exist, not a subscription. Paying does not change the 32/27/23/18 weights, fill a dash, or raise a score. The size label is still not a factor after payment.
Is the InfScore model versioned?
Yes. The public model id is 2026-08-18.1. Audience quality is 32%, engagement strength is 27%, reach and momentum is 23%, and platform strength is 18% on that stamp. Compare two scores only when the model id matches. If the formula changes later, the version string on the card changes with it.
Does buying followers raise audience quality?
No. In the formula, added followers reach the score only through reach and momentum, the capped 23% factor. Follower count isn't what those two rows are calculated from, so added size can't buy audience quality or engagement strength, and followers that don't engage add audience without adding interactions. The log curve gives the same 20 points for each tenfold step from 1,000 to 100 million. InfScore publishes no shortcut, no point reward, and no recovery score for bought followers. A later fetch changes a row only when that row's own public signal changes.