Influencer Audience Demographics: What a Creator Report Can and Can't Show
Influencer audience demographics in a creator report: what each field shows when provided, what it can't tell you, and why Unavailable is never zero.
This versioned composite uses only available public signals. Missing factors stay unavailable and their weight is rebalanced across observed factors. It is not a percentile, price estimate, or guarantee of campaign results. Model 2026-08-18.1.
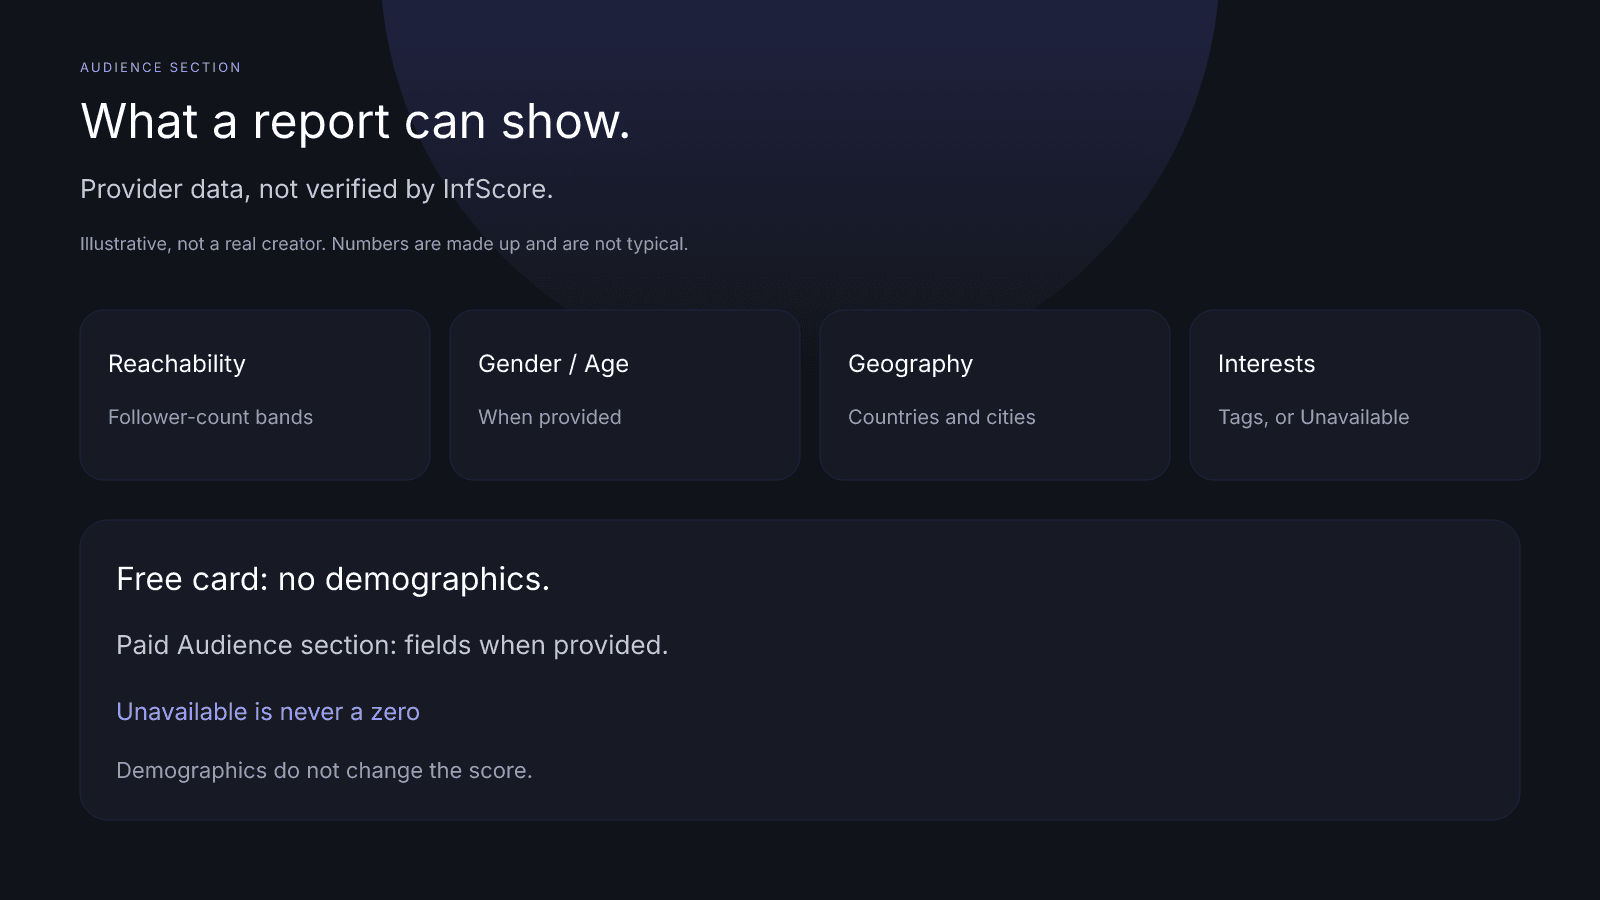
Influencer audience demographics in a creator report are provider data, not verified by InfScore, shown per app when provided: Reachability, Gender, Age, Languages, Top countries and cities, Audience interests, Credibility, and Audience brand affinity. The free InfScore card shows none of it. Any field can read Unavailable, and that is never a zero. Demographics describe who follows; they don't change the score, and they can't say the audience fits your customer.
What audience demographics a creator report can show
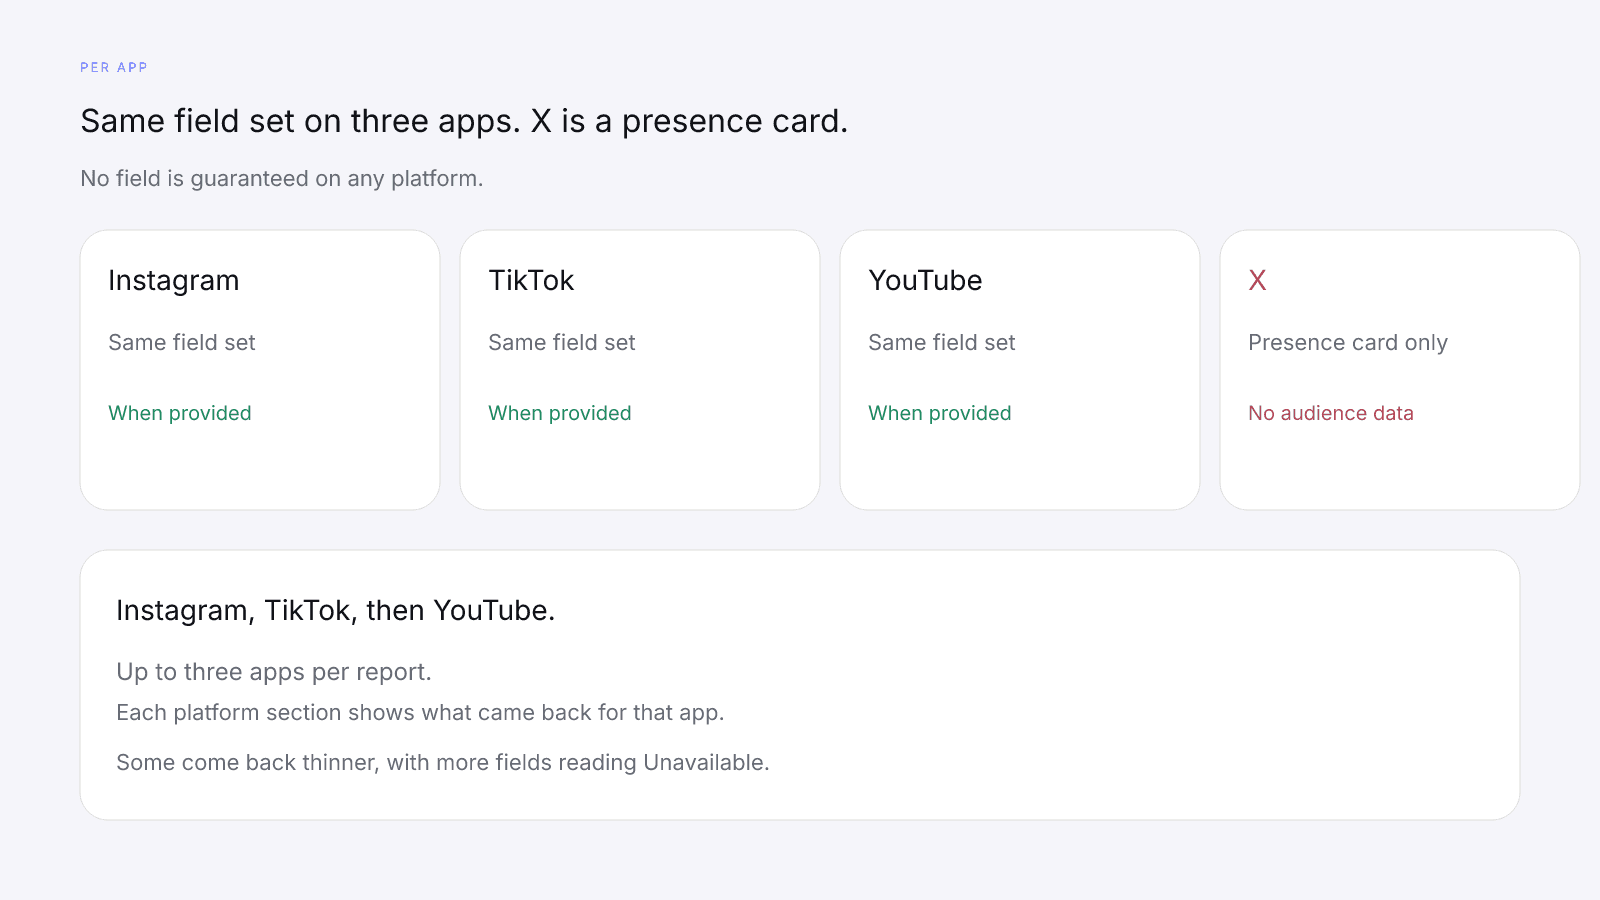
When the provider returned them, a platform's Audience section can show Reachability, Gender, Languages, Age, Top countries, Top cities, Audience interests, Credibility (Followers, Likers, Commenters), and Audience brand affinity. Commenter demographics appear only when the provider returned them. Instagram, TikTok, and YouTube share that field set, and no field is guaranteed on any platform.
Each linked Instagram, TikTok, or YouTube account can get its own section. Some come back thinner than others. A report covers up to three apps. X is a presence card only: it has no deep dive and no audience, and it can appear in Total reach.
The block header is Audience, with the sub-line Demographics, geography, credibility and brand affinity for that platform. Any field the provider didn't return reads "Unavailable". For some apps the whole Audience section is the single word "Unavailable". That's missing data, not a zero, and no field is guaranteed on any platform.
These are provider data for that app. InfScore doesn't verify them, and they don't change the score. Only the followers-credibility percentage feeds audience quality.
Influencer audience analysis on InfScore is this per-app panel. It isn't a blend across apps or a fit score against your customer. Lists show the top entries the provider returned.
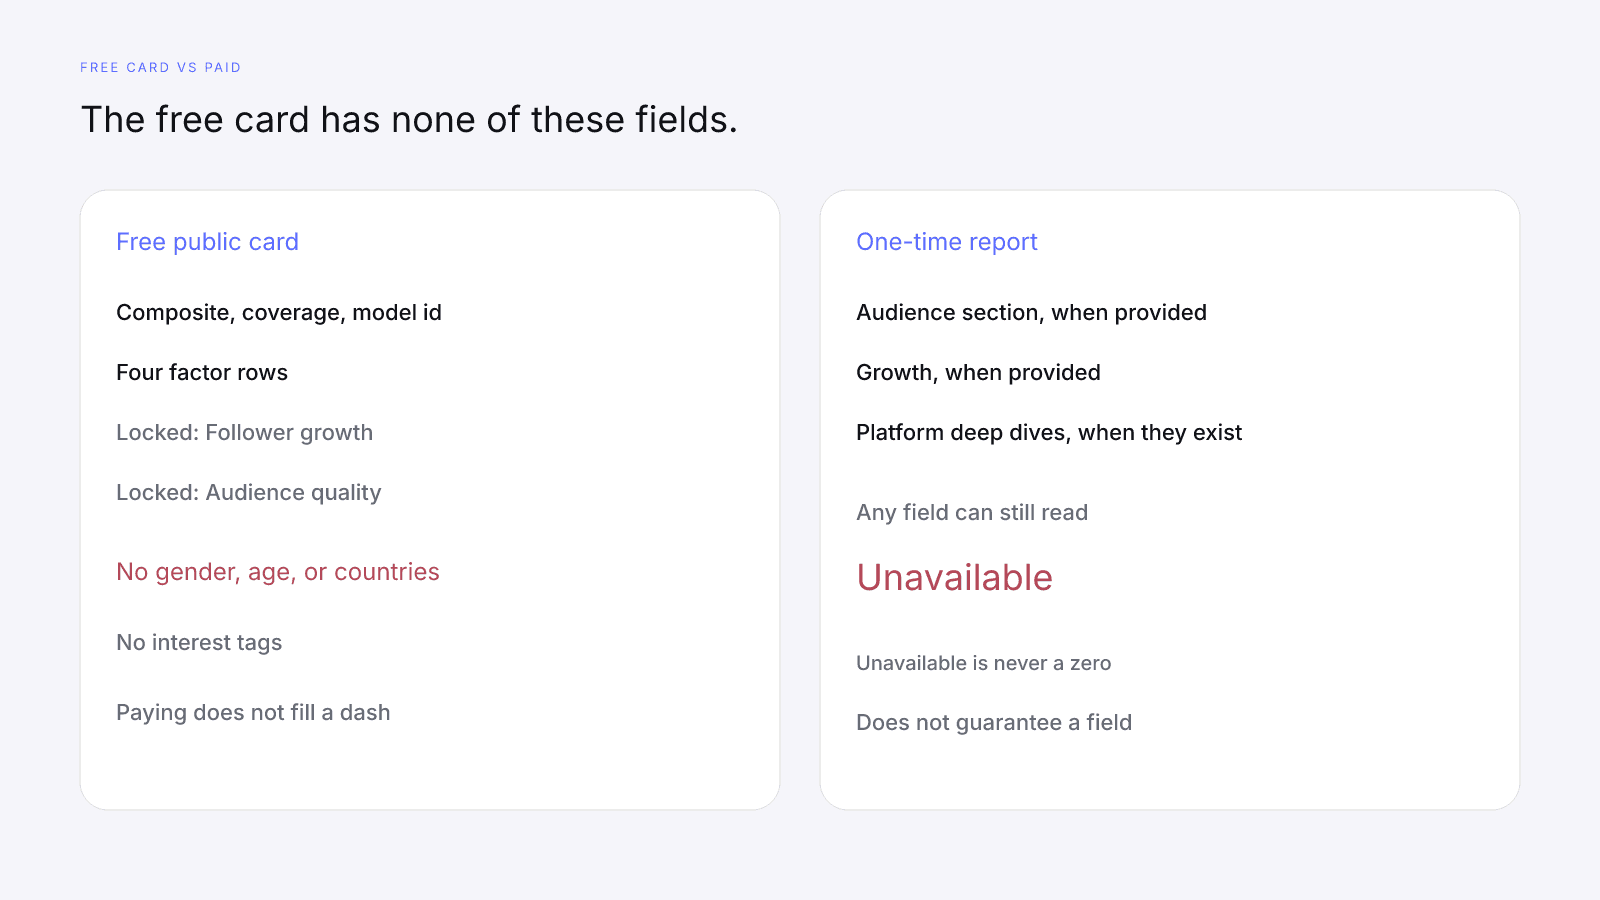
The free card has none; the $0.99 report has the Audience section
The free card has no demographics. It shows the 0-100 InfScore, the tier, scoring coverage, the four factor rows with their weights, the model id, Total public followers, Avg. engagement, and Primary platform. Audience detail sits behind the locked "Audience quality" panel. That panel holds no gender, age, country, city, language, or interest fields.
The $0.99 purchase is one-time and buys the full creator report, with audience, growth, and platform deep dives when they exist. Paying does not fill a dash, and no audience field is guaranteed, even after paying. A paid report can still print Unavailable on every audience row.
The paid report also has an InfScore-branded PDF download. It prints the report's provider data, including the Audience fields that came back, and no score, tier, model id, or coverage.
Free InfScore vs the $0.99 Report already covers what stays the same when you pay. Here the focus is the demographic fields and what each one can and cannot show.
The audience fields, one at a time
When influencer audience data exists for an app, the fields below can appear, each only when provided, and any of them can read Unavailable.
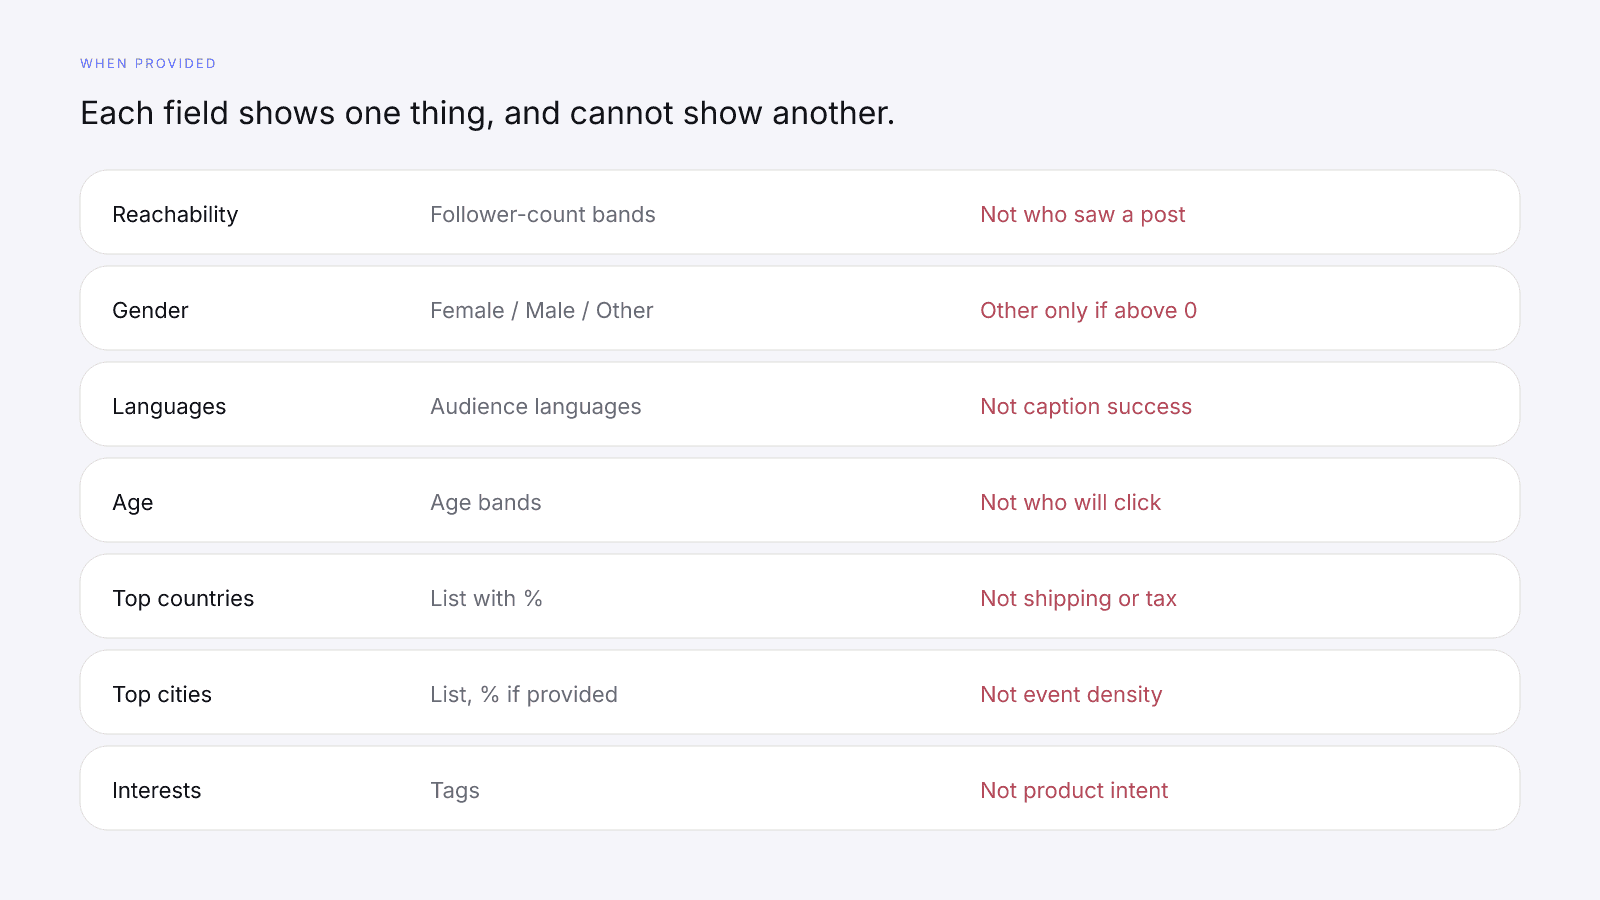
Reachability carries the sub-line Follower count distribution of the creator's audience. Bars show how that audience splits across follower-count bands, or the row reads Unavailable. It can't tell you who saw a post, and InfScore's reach figure is a follower sum, not impressions or views.
Gender shows Female, Male, and Other, and Other appears only when it's above 0. If the gender total is empty or not positive, the block reads Unavailable. The split can't tell you who'll buy, click, or watch a sponsored post.
Languages comes back as a list, or Unavailable. It won't tell you the language of a given comment thread or whether a caption will land.
Age shows age bands with percentages, or Unavailable. Those bands can't tell you the age of the people who'll click or convert.
Top countries is a list with percentages, or Unavailable. It says nothing about shipping, tax, or whether a country is allowed on your brief.
Top cities is a list, with percentages when provided, or Unavailable. It can't tell you whether a city is dense enough for an event.
Audience interests shows tags with no percentages, or Unavailable. The tags don't tell you that those accounts want your product.
Read each filled field against your own customer. It's still provider data, not verified by InfScore, for one app.
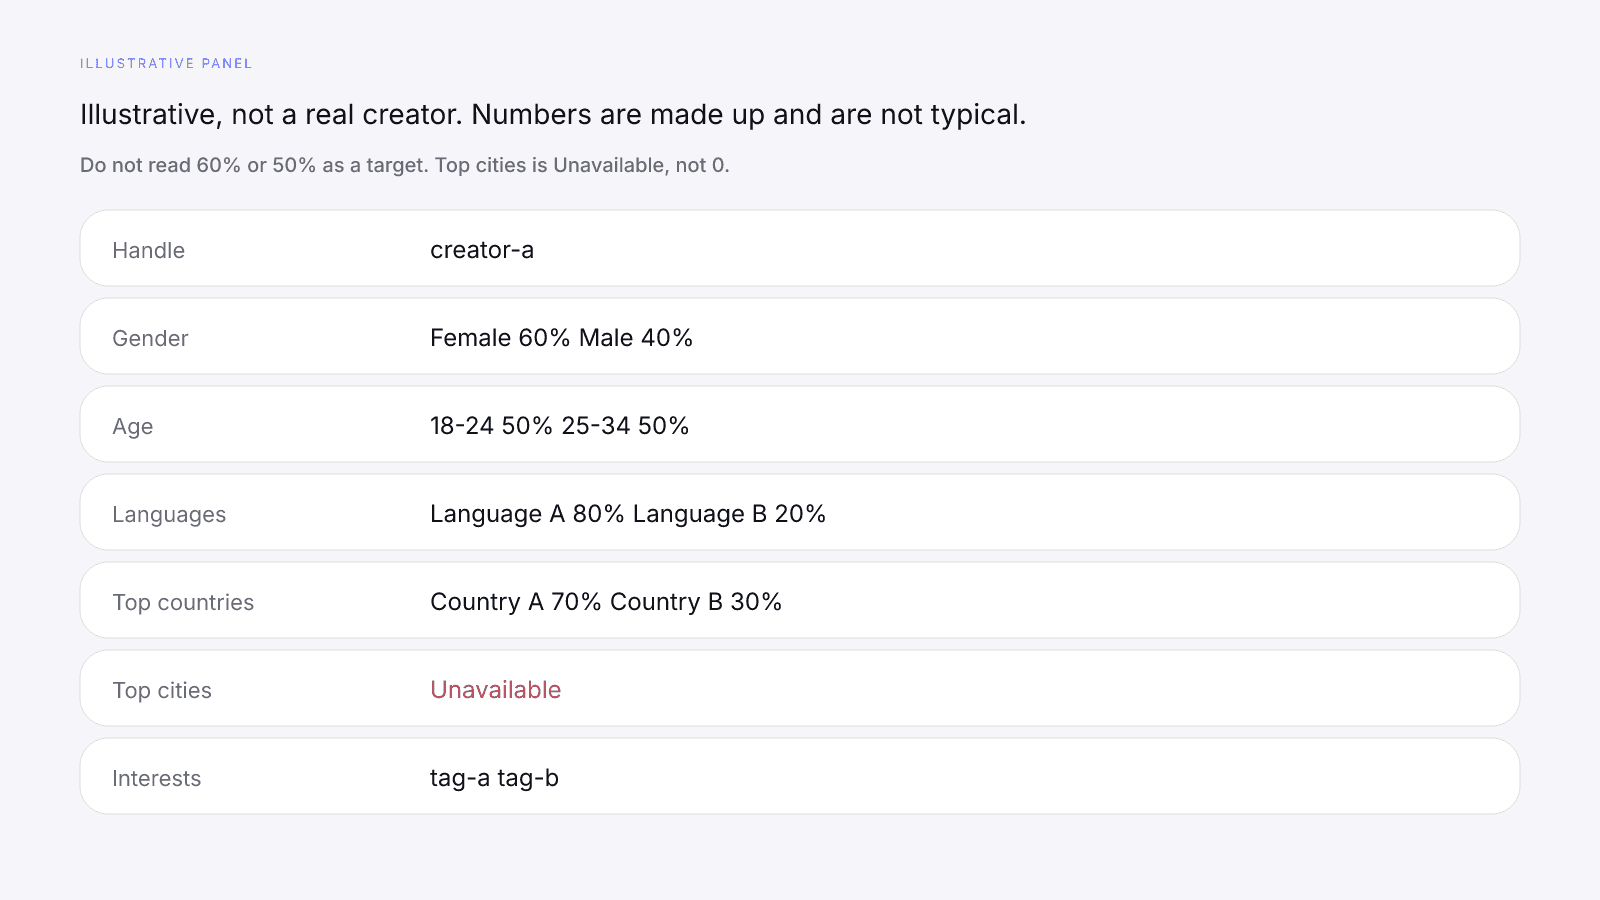
The panel below is illustrative, not a real creator: the placeholder handle is creator-a, and the numbers are made up and not typical. Don't treat 60% or 50% as a target, and don't read the Unavailable city row as a zero.
| Field | Illustrative value |
|---|---|
| Reachability | Round follower-count bands |
| Gender | Female 60%, Male 40% |
| Languages | Language A 80%, Language B 20% |
| Age | 18-24 50%, 25-34 50% |
| Top countries | Country A 70%, Country B 30% |
| Top cities | Unavailable |
| Audience interests | tag-a, tag-b |
Credibility, commenters, and brand affinity
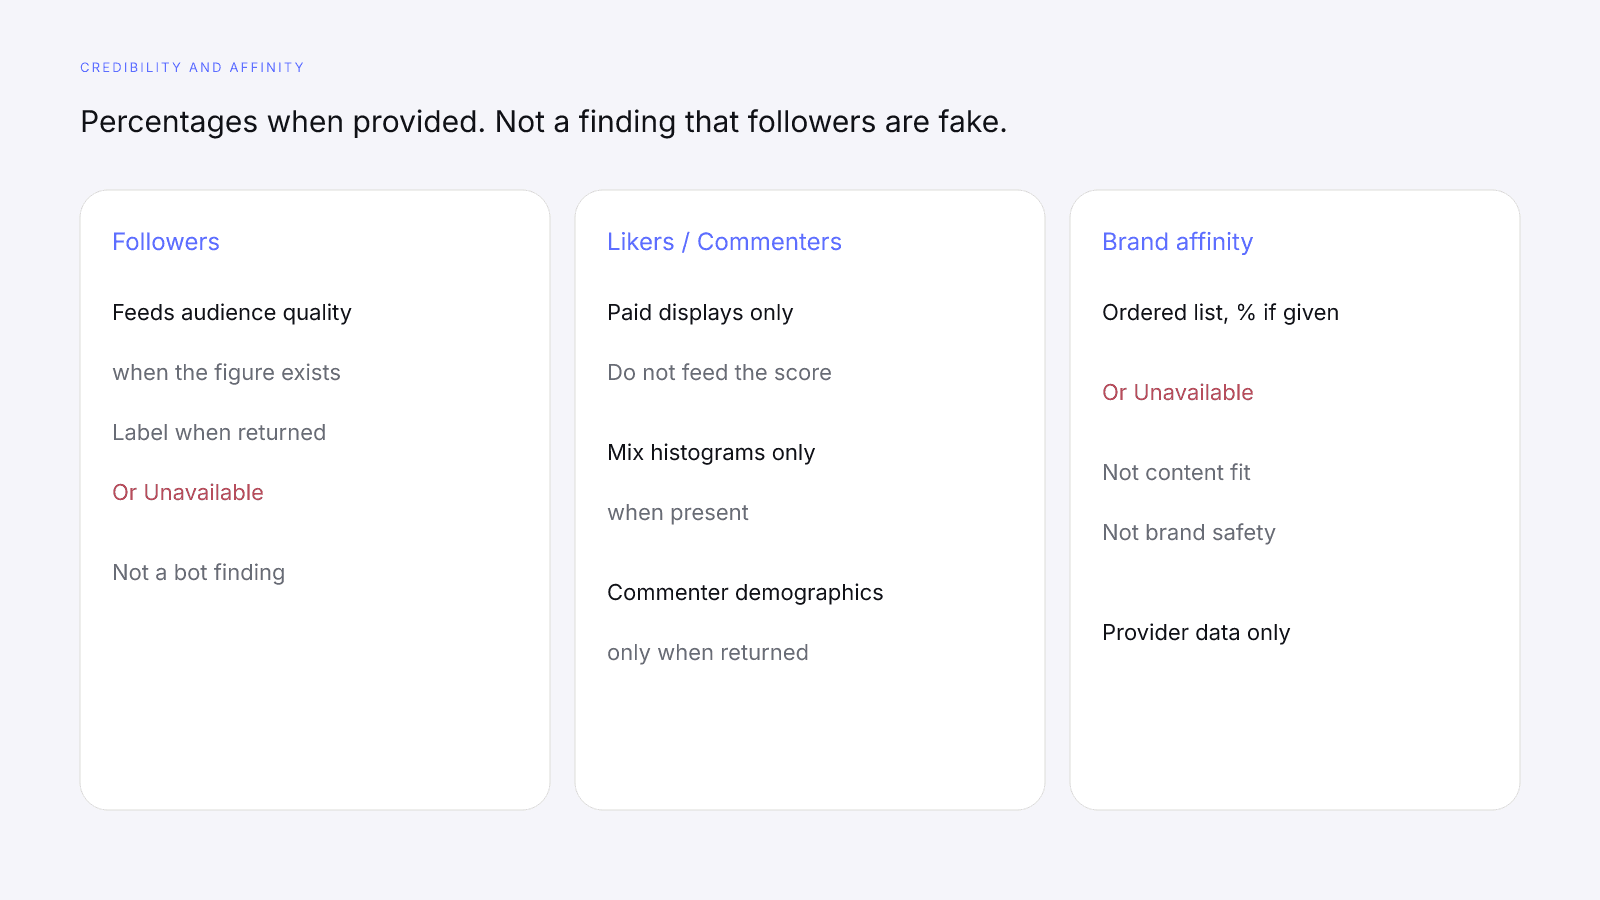
Credibility shows Followers, Likers, and Commenters as a percentage or "Unavailable", with a credibility label under Followers when the provider returned one. It doesn't prove or disprove fake followers or bots. Only Followers can feed audience quality, and only when that percentage exists. Likers and Commenters are paid displays. How to Check for Fake Followers Without Accusing Anyone covers that signal in depth.
Followers credibility mix, Likers credibility mix, and Commenters credibility mix appear only when present, and they're omitted otherwise.
Commenter demographics sit under Commenters, with the sub-line Demographics of accounts that comment, when the provider returned them. The sub-block can include Commenters gender, Commenters age, Commenters countries, and Commenters cities.
Audience brand affinity shows an ordered list, with percentages when provided, or Unavailable. It isn't a content-fit grade or a finding about brand safety.
The other blocks in a report, and their limits
A paid report can also show blocks that aren't demographic fields, and each has its own limit.
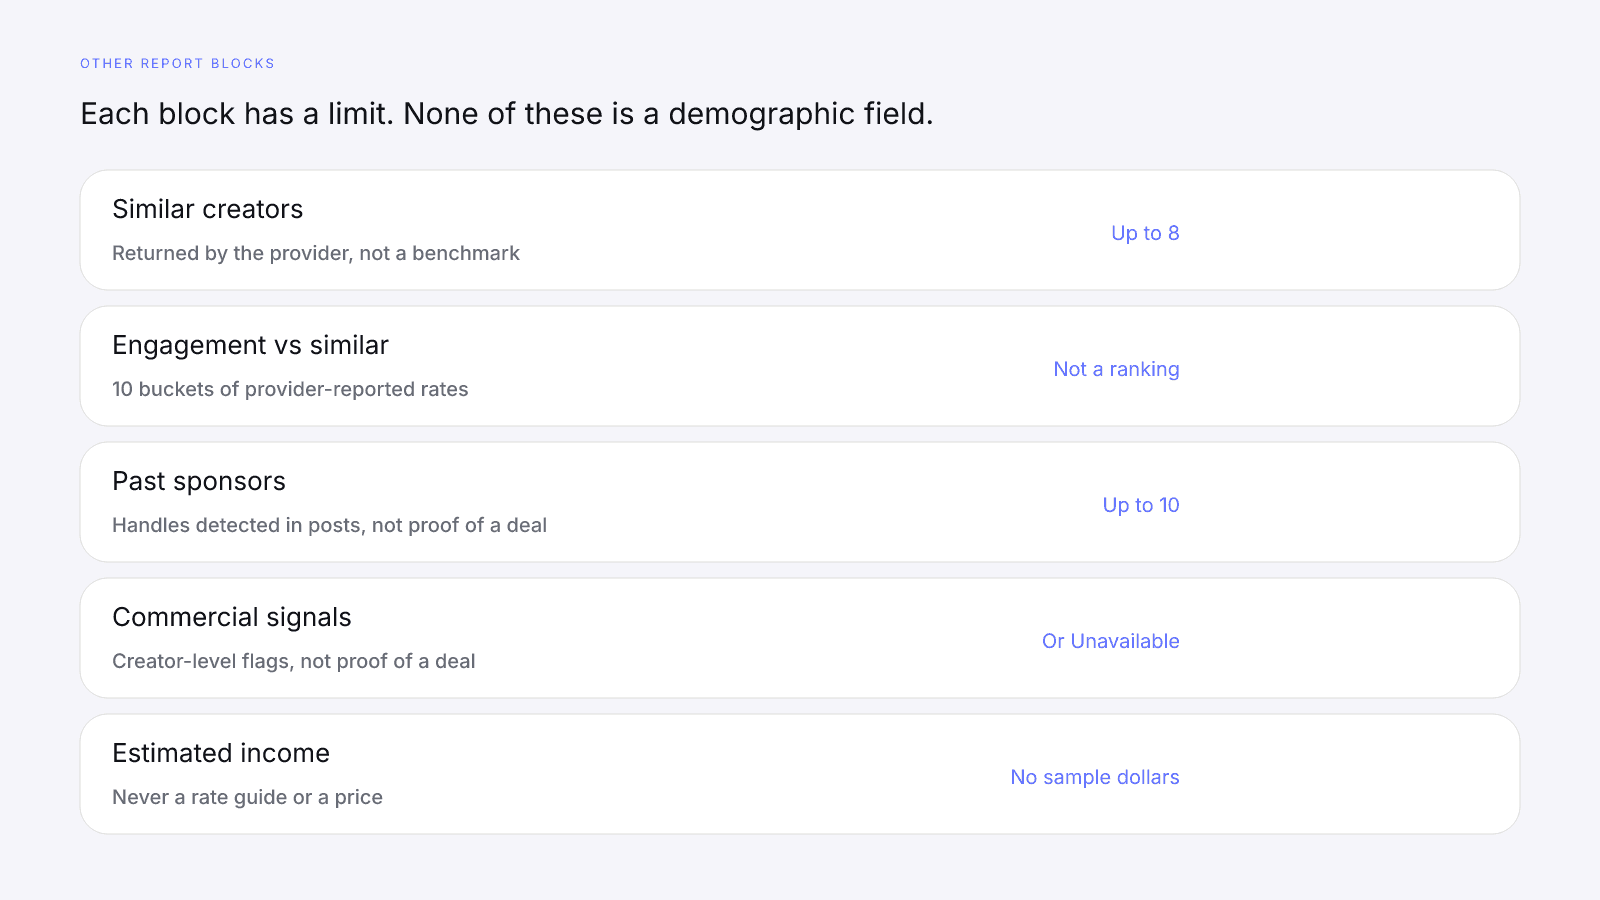
Similar creators are similar creators returned by the provider, not a benchmark or a ranking. The list holds up to 8 rows, with Account, Followers, and Engagement. An empty list reads Unavailable. The "Engagement vs similar creators" chart counts their engagement rates in ten buckets. It marks the creator's rate, and it is not a percentile or a ranking. When those rates weren't returned, it reads "Unavailable — similar-creator engagement rates were not returned for this platform." The chart needs similar creators for that platform, and the engagement it plots is provider-reported.
Past sponsors are brand handles the provider detected in posts, not proof of a deal, a result, or an endorsement. The list holds up to 10, with a post count when the provider returned one. An empty list reads Unavailable. Confirm any handle with the creator before you repeat it.
Commercial signals sit at report level, not per platform. They are provider flags such as Works with brands, Promotes affiliate links, Link in bio, Business account, and Creator account, not proof of a deal. When none of those flags came back, the block reads Unavailable.
Estimated income is the provider's estimate, labelled "Last 12 months · {platform}-attributable revenue." It isn't a rate guide or a price. Empty data reads Unavailable.
Creator growth is a separate block about follower change, not an audience field.
When a block says Unavailable
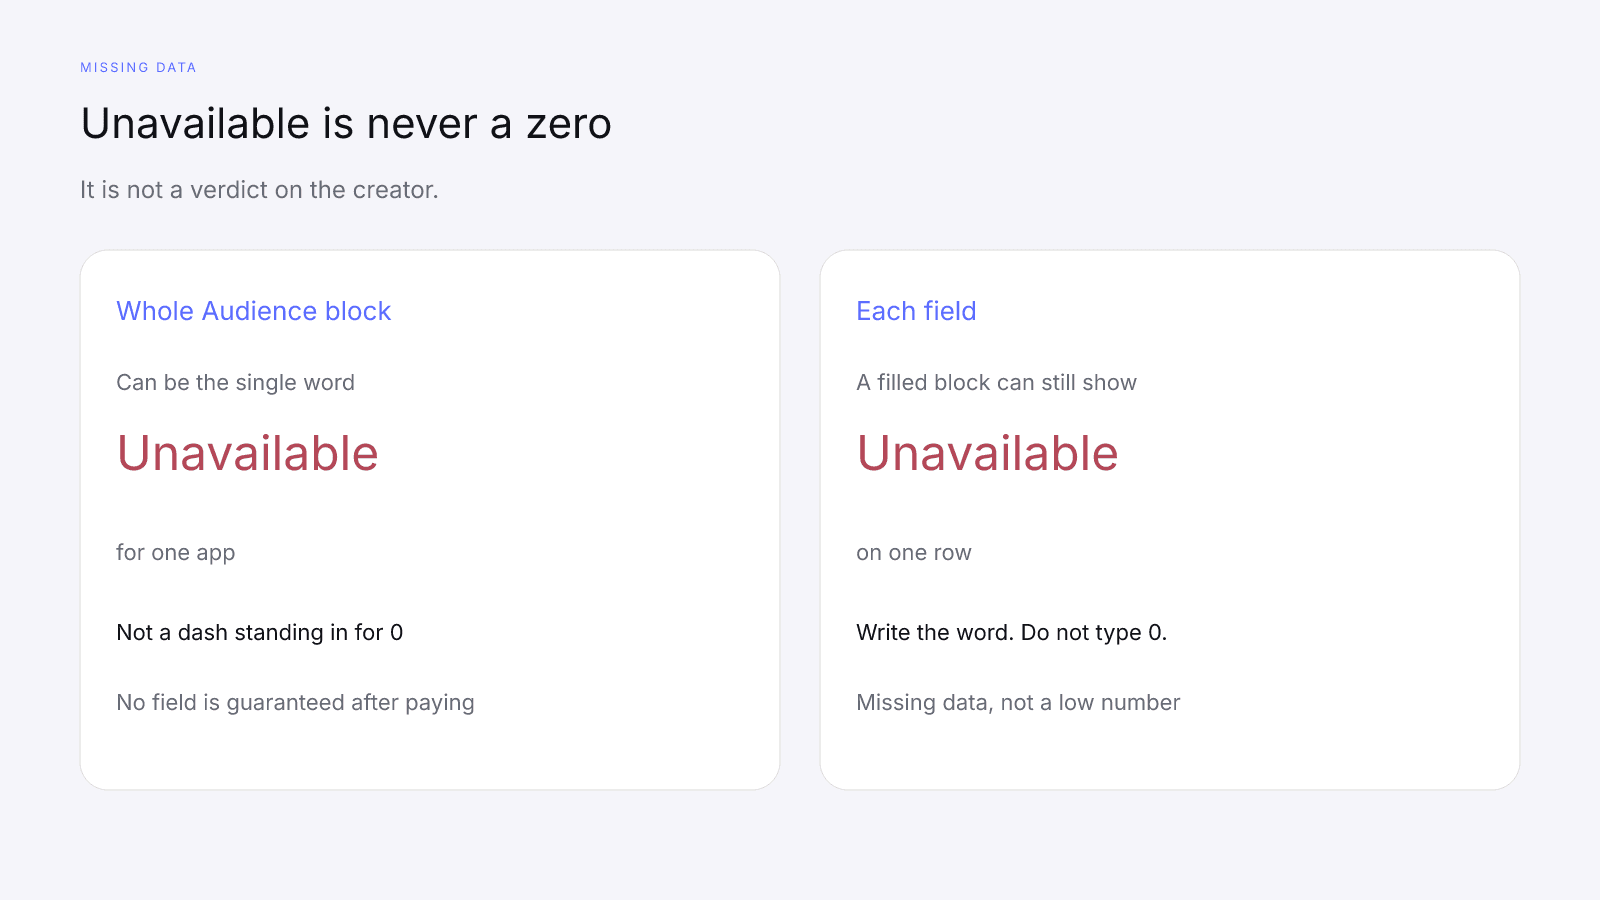
Unavailable can cover one field or, for some apps, the whole Audience section. Either way it's missing data, not a zero, and never a verdict on the creator.
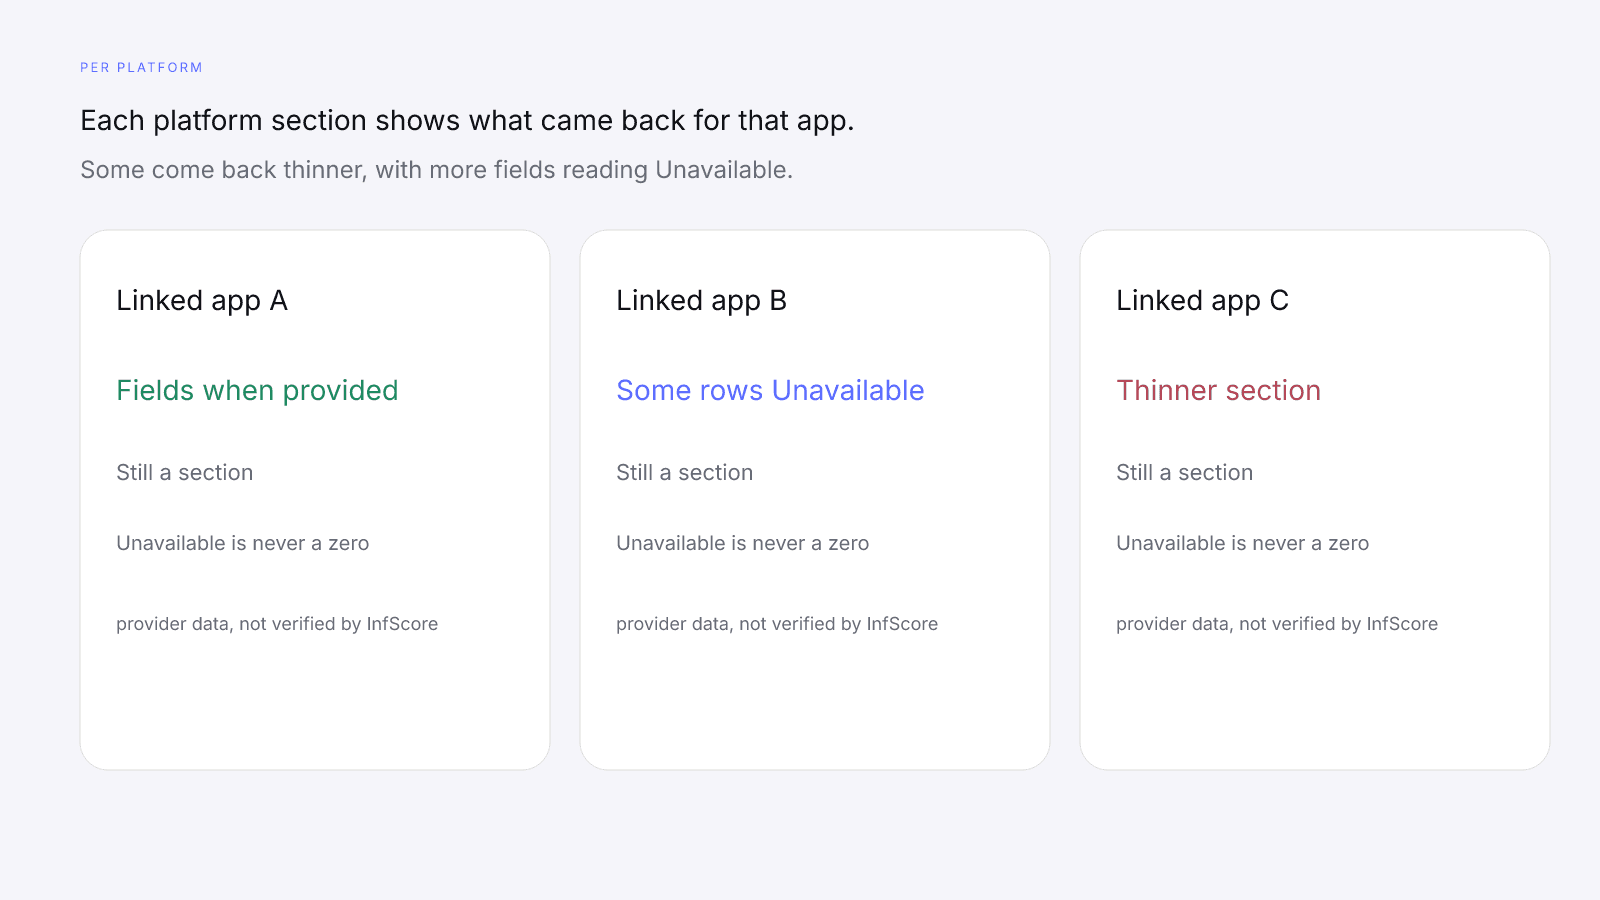
Each platform section shows what came back for that app; some come back thinner, with more fields reading Unavailable. A thinner section is still a section, not a missing app or a zero.
A completed purchase can still show Unavailable in sections, and no field is guaranteed after paying.
A dash on a free-card factor row is also missing data, not a zero. Missing Data on Creator Metrics covers those rows. Audience fields use the word Unavailable rather than a dash. Don't type 0 into a sheet for either one.
What none of it changes in the score
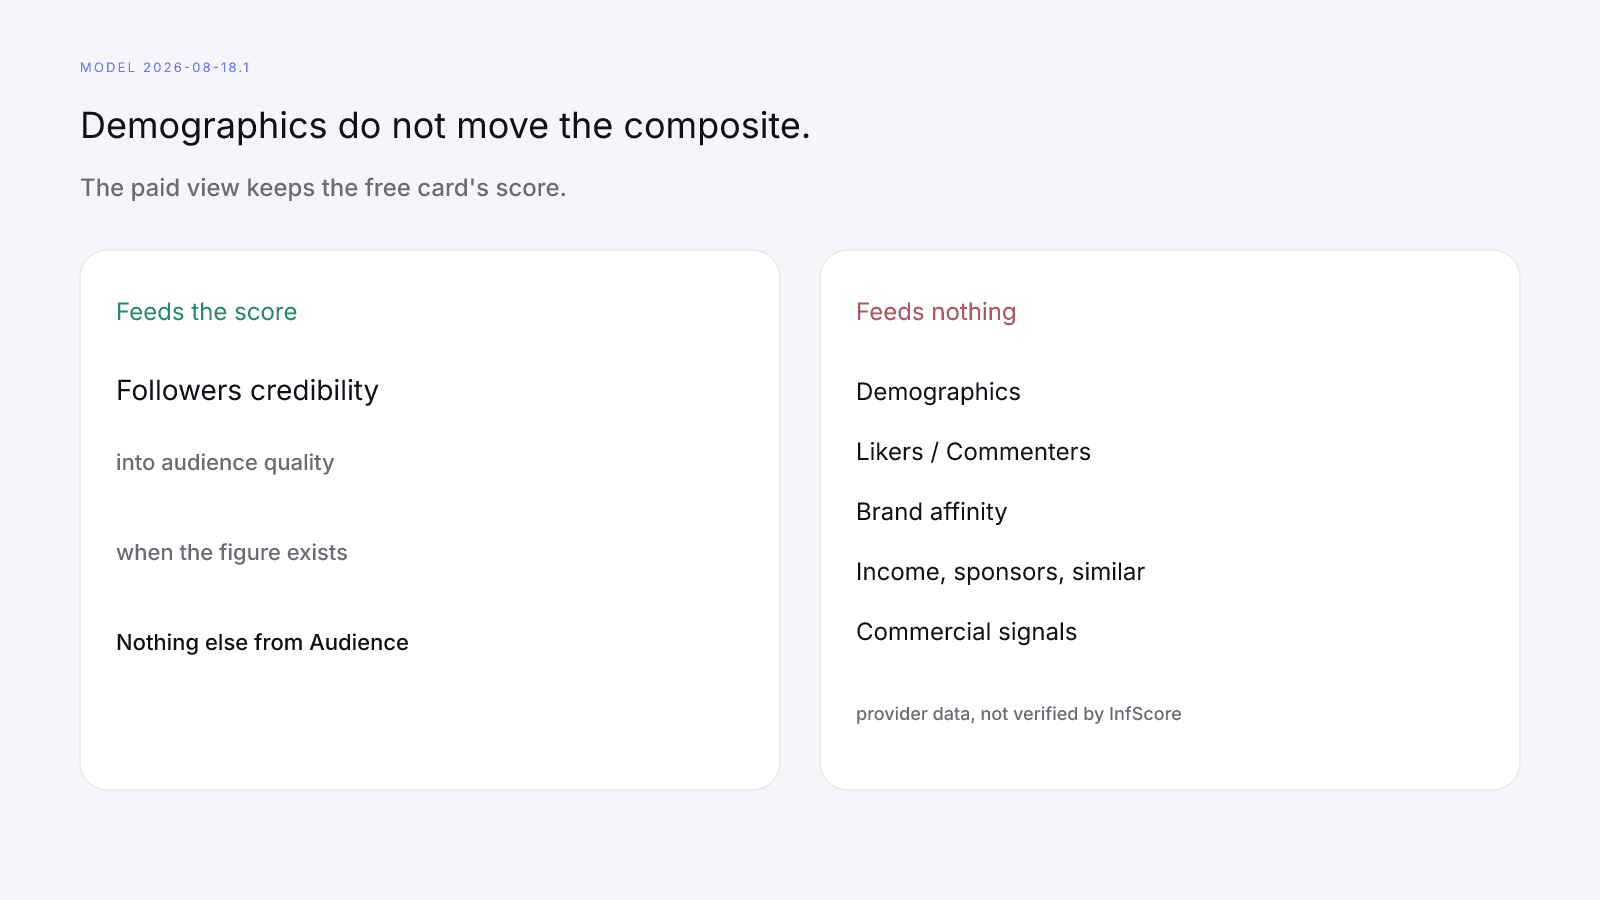
Demographics, Likers and Commenters credibility, brand affinity, Estimated income, Past sponsors, similar creators, and commercial signals feed nothing in the score. On model 2026-08-18.1 the published weights are audience quality 32%, engagement strength 27%, reach and momentum 23%, and platform strength 18%. Only the followers-credibility percentage feeds audience quality. Audience Quality vs Follower Count covers that row, and follower count stays a size label on a different row.
The paid view keeps the free card's coverage, model id, and score. It is not a percentile, price estimate, or guarantee of campaign results.
Using demographics in vetting: questions, not cutoffs
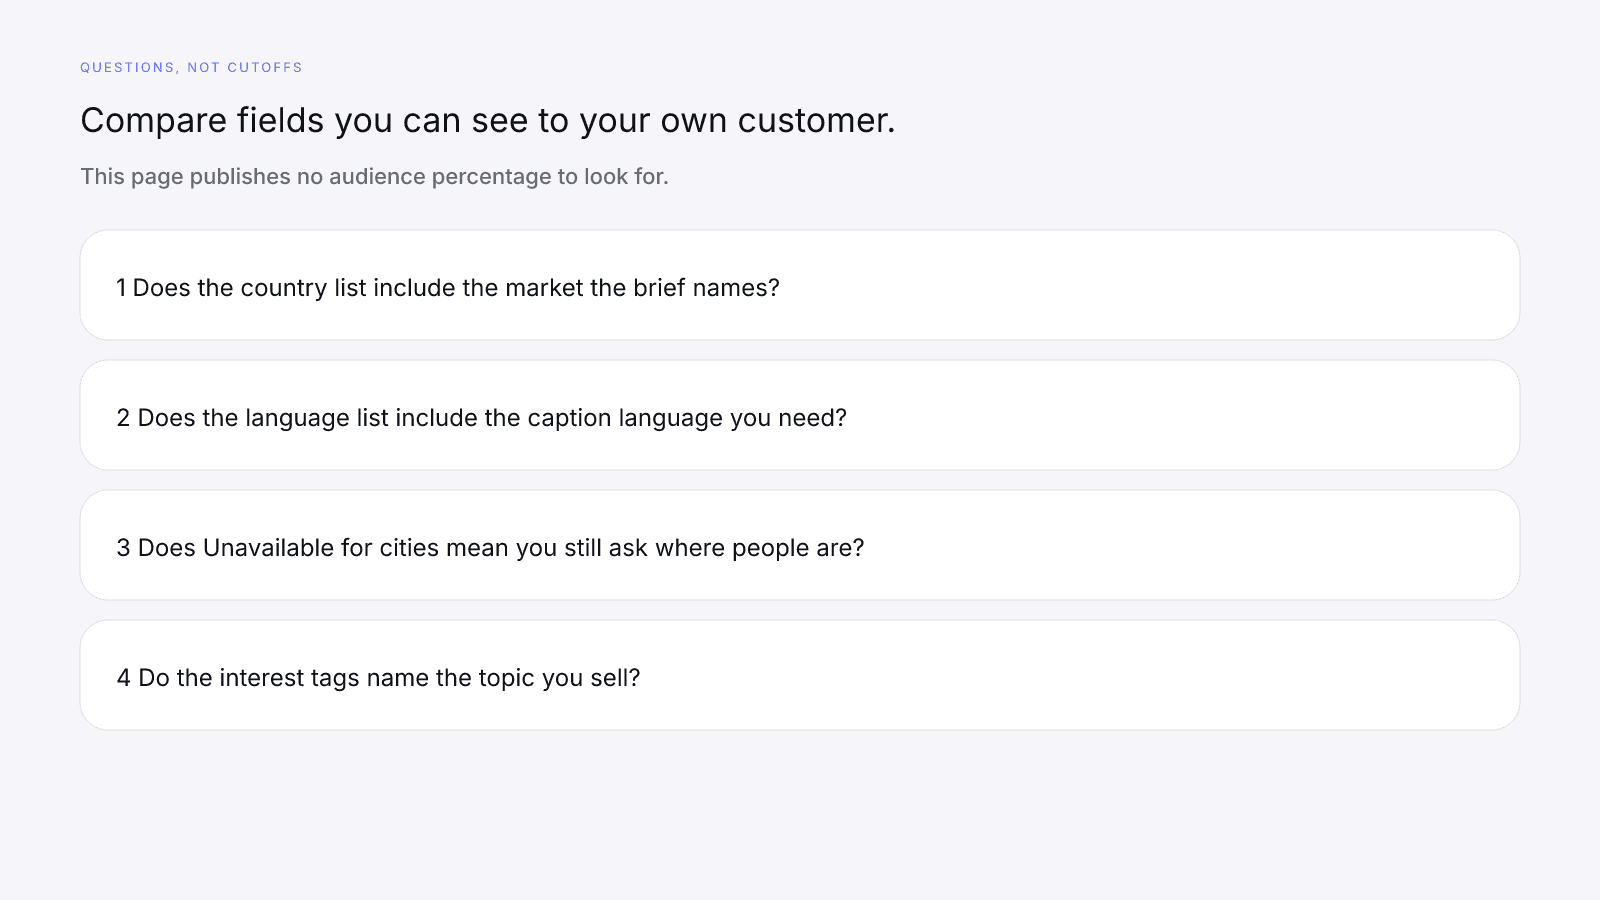
Use the fields you can see as questions against your own customer and brief. InfScore publishes no cutoff and no audience percentage to look for.
A few questions to ask:
- Does Top countries, when provided, include the market the brief names?
- Does Languages, when provided, include the caption language you need?
- Does an Unavailable Top cities row mean you still need to ask the creator where people are?
- Do Audience interests, when provided, name the topic you sell, or a neighboring topic?
To check influencer audience fit, write those answers next to the brief. InfScore doesn't find creator contacts or send outreach for you. How to Vet an Influencer Before You Pay Them is the vetting order.
InfScore has no compare, shortlist, sort, or export tools. If you keep rows in your own sheet, Influencer Shortlist Template: Compare Creators on One Model is the column set. Put paid demographic figures, when provided, only in a column labelled as paid.
FAQ and next steps
Look up a creator's free InfScore at infscore.com. The free card needs no sign-up and shows no demographics.
See what the $0.99 report includes on Pricing.
Does the free InfScore card show audience demographics?
No. The free card has no demographics. It shows the 0-100 InfScore, the tier, scoring coverage, the four factor rows with their weights, the model id, Total public followers, Avg. engagement, and Primary platform. Audience detail sits behind the locked Audience quality panel.
What audience demographics does the $0.99 report show?
When the provider returned them, a platform's Audience section can show Reachability, Gender, Languages, Age, Top countries, Top cities, Audience interests, Credibility (Followers, Likers, Commenters), and Audience brand affinity. Commenter demographics appear only when the provider returned them. The $0.99 purchase is the full creator report, with audience, growth, and platform deep dives when they exist. No field is guaranteed, even after paying.
Is every demographic available for every platform?
No. Instagram, TikTok, and YouTube share the same field set, and no field is guaranteed on any platform. Each platform section shows what came back for that app; some come back thinner, with more fields reading Unavailable. X is a presence card only: it has no deep dive and no audience. It can appear in Total reach.
Does Unavailable mean zero or a weak audience?
No. Any field the provider didn't return reads Unavailable. For some apps the whole Audience section is the single word Unavailable. That's missing data, not a zero, and not a verdict on the creator. No field is guaranteed, even after paying.
Do demographics change a creator's InfScore?
No. These are provider data for that app. InfScore doesn't verify them, and they don't change the score. Only the followers-credibility percentage feeds audience quality. The paid view keeps the free card's score, coverage, and model id.
Can demographics show whether followers are fake?
No. Credibility shows Followers, Likers, and Commenters as a percentage or Unavailable, with a credibility label under Followers when the provider returned one. It doesn't prove or disprove fake followers or bots. The dedicated credibility guide covers that signal.
What audience percentage should I look for?
None that InfScore publishes, and there's no audience percentage to use as a cutoff. Compare the fields you can see to your own customer and brief, and treat Unavailable as missing data rather than a low number.