How to Calculate Engagement Rate on Instagram, TikTok, and YouTube
How to calculate engagement rate on Instagram, TikTok, and YouTube: by followers, reach, or views, with worked examples, and what InfScore does with it.
This versioned composite uses only available public signals. Missing factors stay unavailable and their weight is rebalanced across observed factors. It is not a percentile, price estimate, or guarantee of campaign results. Model 2026-08-18.1.
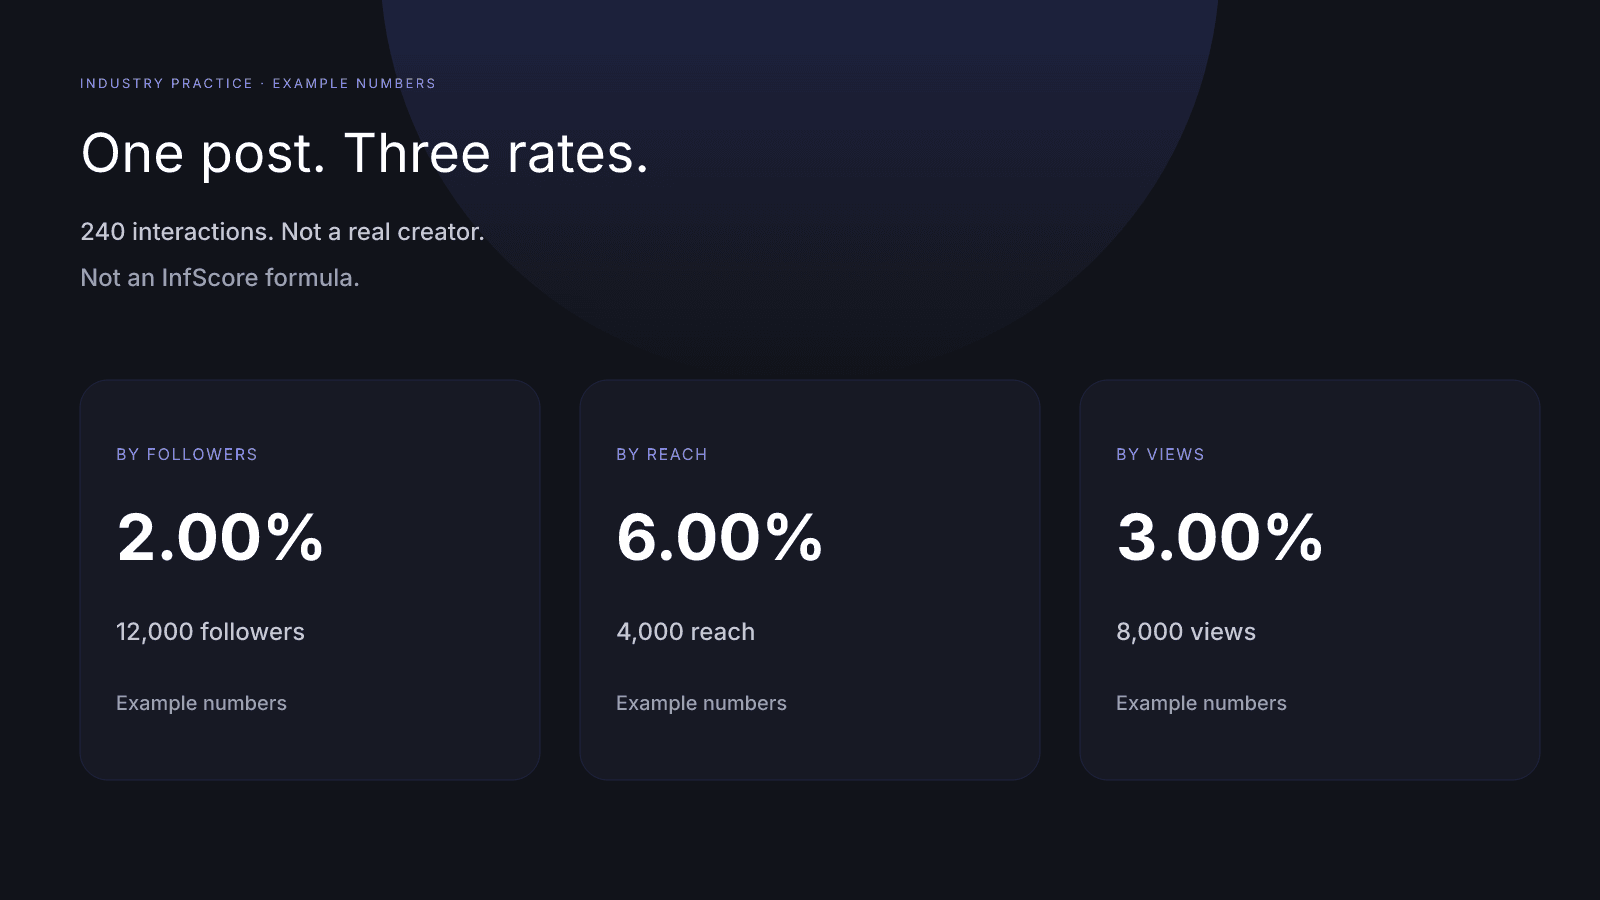
How to calculate engagement rate: engagement rate = interactions ÷ followers × 100, and swapping followers for reach or views gives a different rate, because the denominator changes the number. Every example in this guide uses made-up numbers, not a real creator. InfScore does not calculate its own rate: it uses the provider-reported public rate. Whether a rate is good is covered in what a good engagement rate looks like.
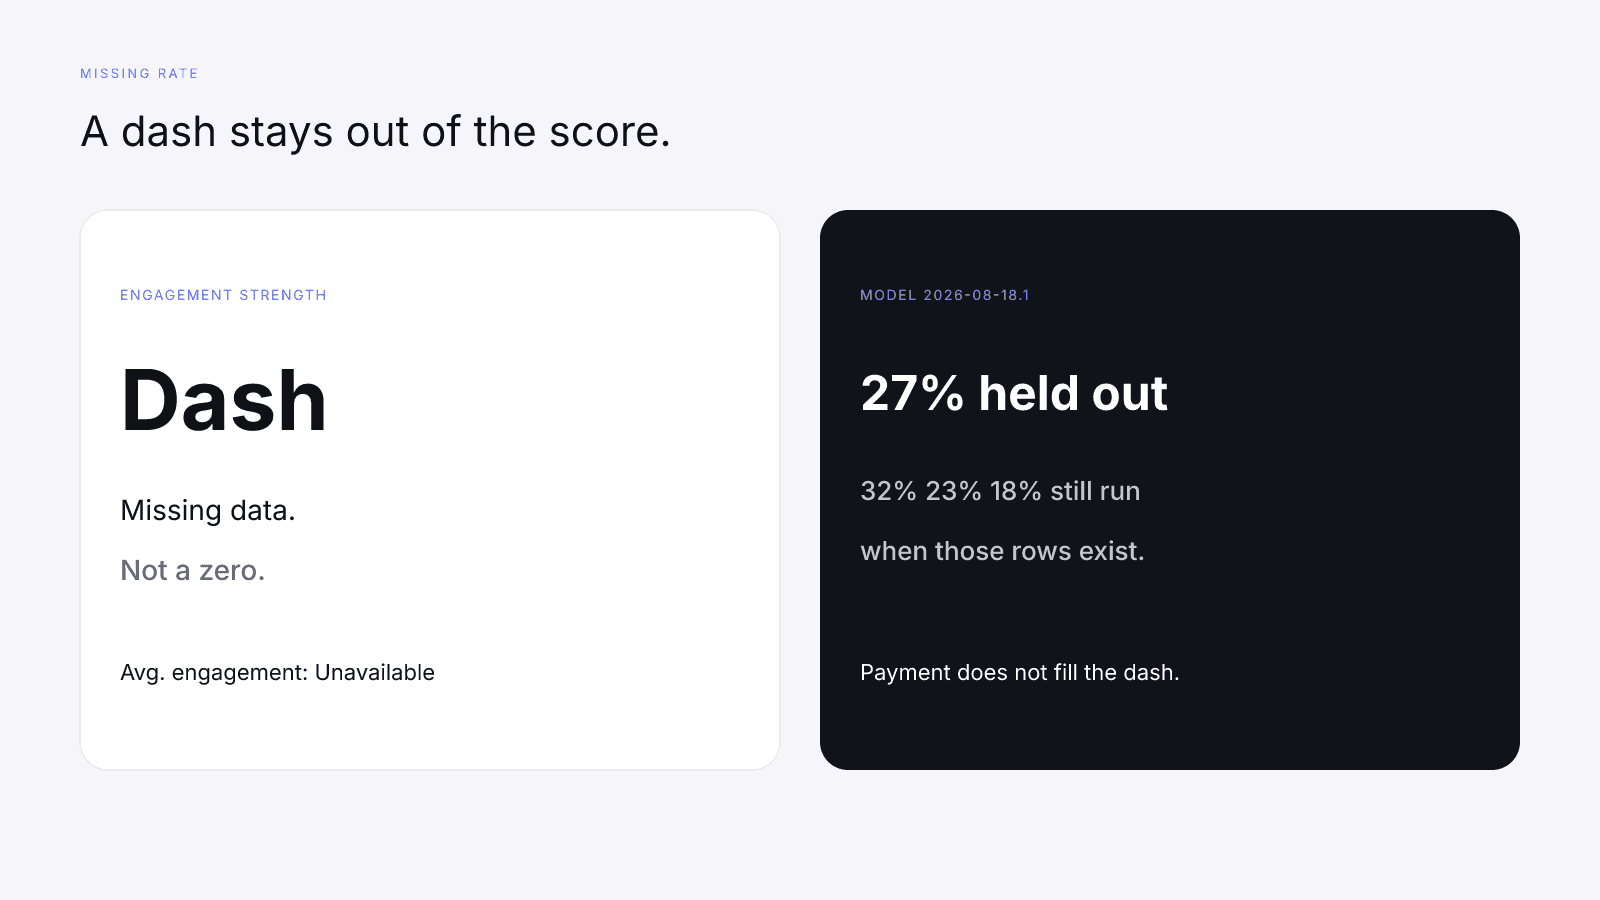
On model 2026-08-18.1 the weights are audience quality 32%, engagement strength 27%, reach and momentum 23%, and platform strength 18%. A dash is missing data, not a zero, and its weight is held out. How to Measure Influencer Performance walks through all four factors, and the methodology prints the same weights.
How to calculate engagement rate: the basic formula
Engagement rate is the share of an audience that interacted with a post, expressed as a percentage. Pick the interactions you count, divide by a denominator, and multiply by 100.
The formula line is interactions ÷ denominator × 100. What changes is which interactions you count and which denominator you pick. The formulas in this guide are general industry practice, and InfScore doesn't apply any of them; the number on the card is the provider's rate, passed through as reported.
Public write-ups don't agree on the interaction list. Some count likes and comments only, some add shares, some add saves. This guide doesn't pick a winner. Whatever you choose, write it down before you compare two rates. If one includes saves and the other doesn't, you're no longer comparing denominators.
A hand calculation has five lines:
- Write which interactions you are counting, and the count.
- Write the denominator (followers, reach, or views) and its count.
- Divide interactions by that denominator.
- Multiply by 100.
- Label the result with the denominator you used.
If the interactions were zero, the finished formula equals zero, and that's a real zero. If the denominator was never provided, the line can't be finished, so leave it blank. Typing 0 into a missing reach cell claims "no one was reached," which is not the same as "the reach figure wasn't on the sheet."
Engagement rate by followers
The by-followers formula divides interactions by followers, then multiplies by 100: interactions ÷ followers × 100.
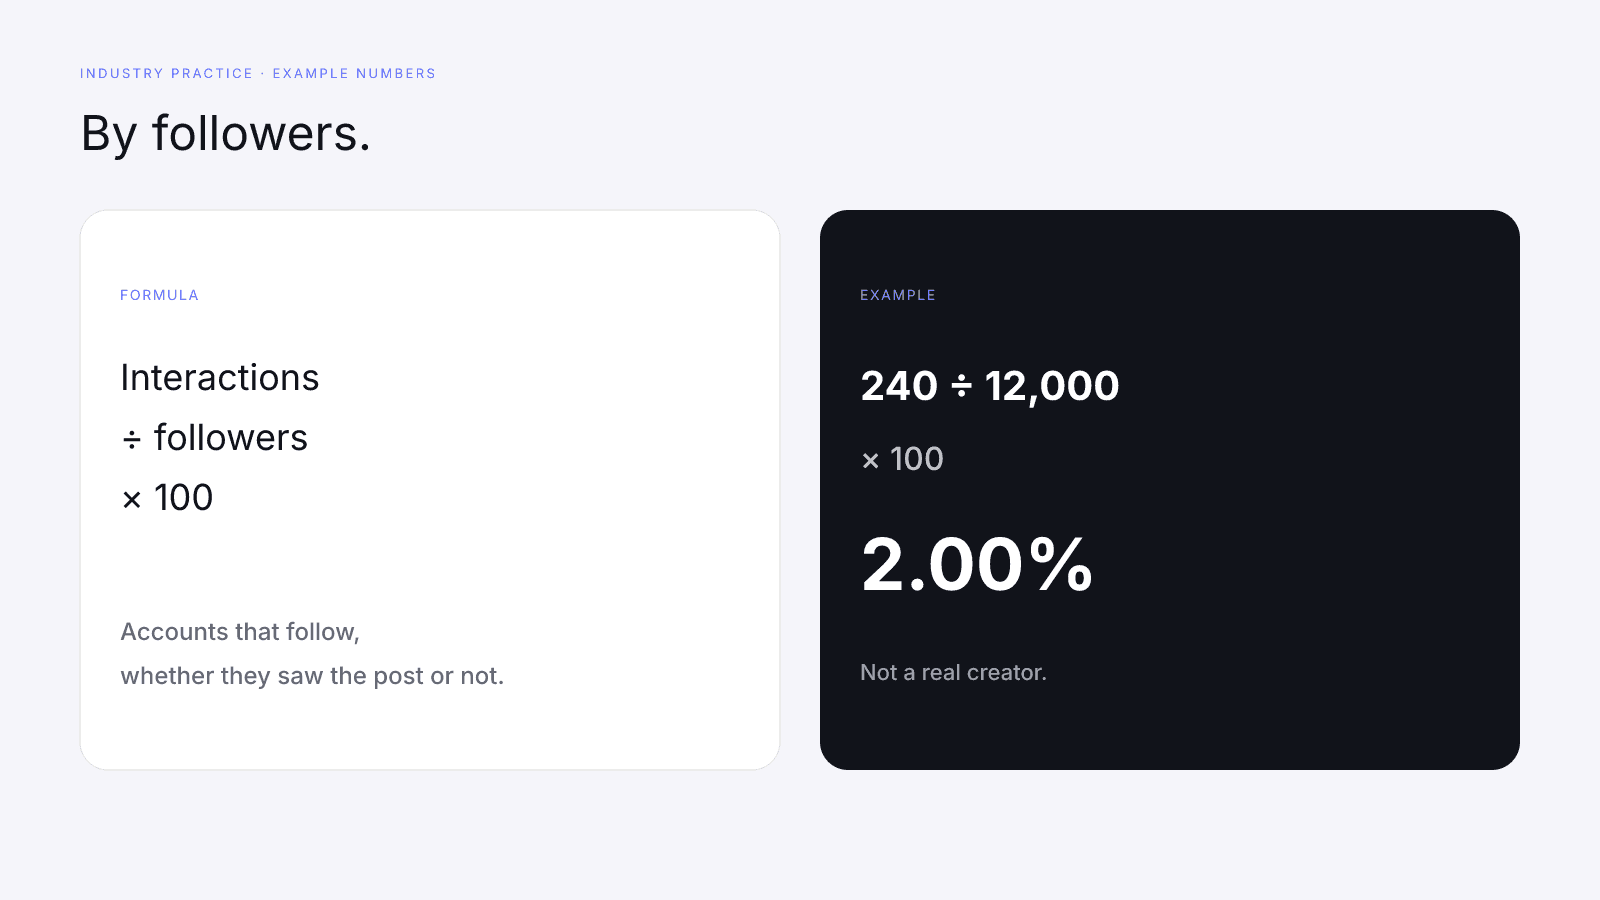
Followers are accounts that follow the profile, including people who never saw this post. In the example below, 12,000 followers and 240 interactions give 2.00%. The rate can look quiet even when the people who did see the post responded, because the denominator still holds everyone who follows.
The example's 2.00% is a property of the formula, not a grade. A by-followers rate measures interactions against the follower count. It doesn't measure them against the people who saw the post, or against views. Use it when follower count is the number you have, and label it, so nobody later reads the example's 2.00% as a reach rate.
Instagram, TikTok, and YouTube all show a follower or subscriber count on a public profile. That's why by-followers turns up so often in pitches: you can finish it from the outside. But a rate you can finish isn't automatically one you can compare. A by-followers rate from one pitch and a by-views rate from another are different kinds of number.
Engagement rate by reach
The by-reach formula divides interactions by reach, then multiplies by 100: interactions ÷ reach × 100. Here, reach means accounts that saw the post.
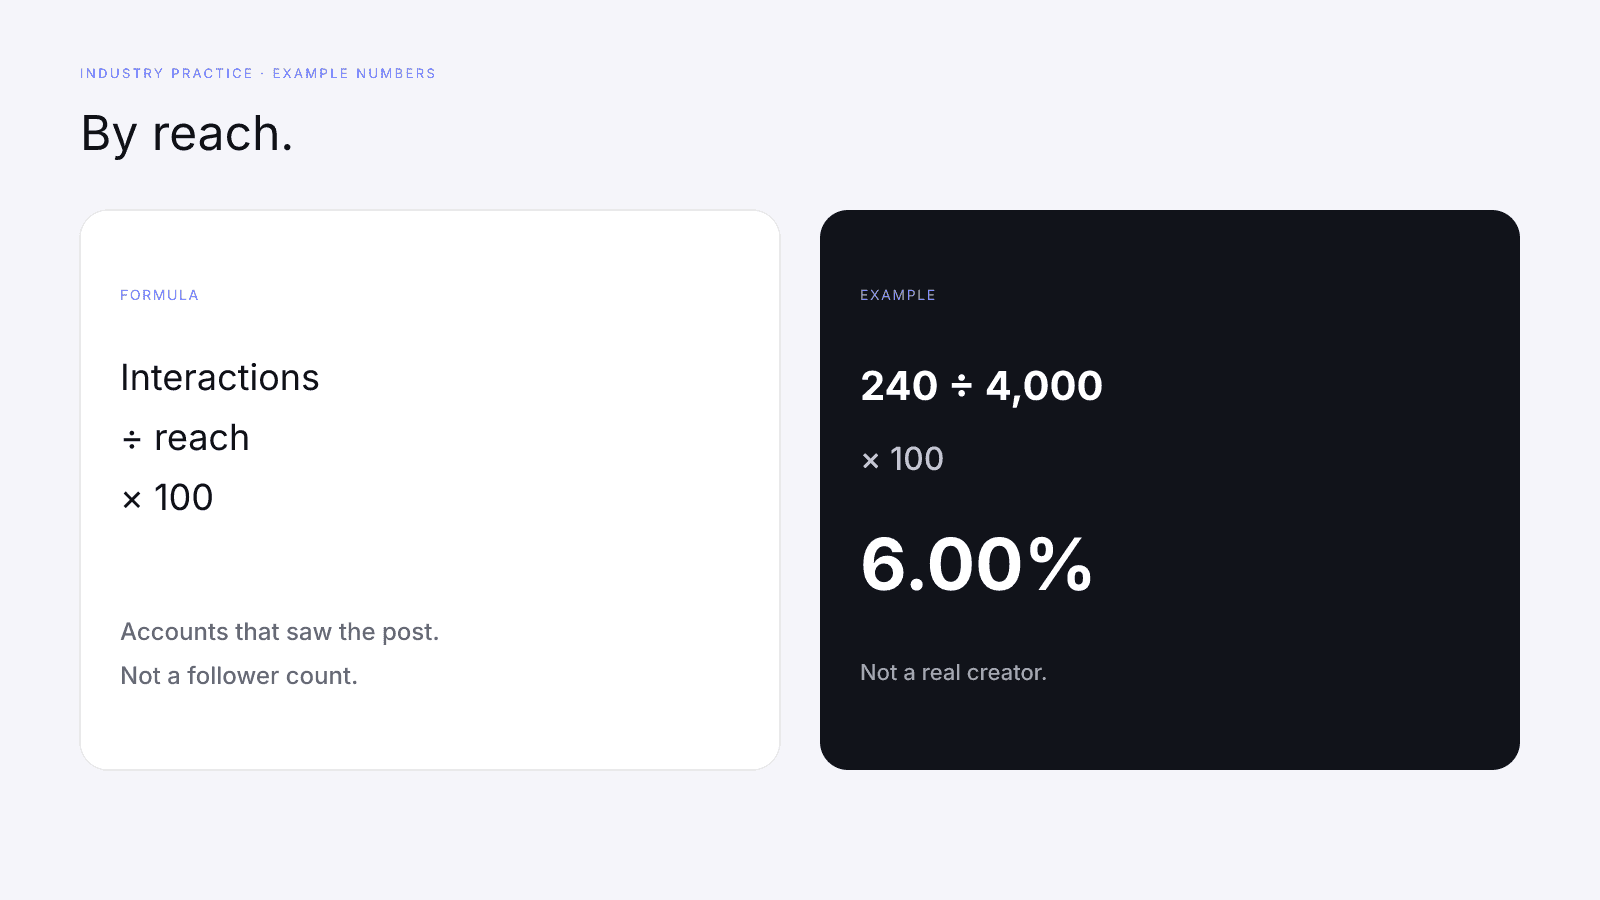
The example sets reach at 4,000, so 240 ÷ 4,000 × 100 = 6.00%. That's higher than 2.00% only because the denominator dropped from 12,000 followers to 4,000 accounts reached. Nothing else about the post changed. If a later sheet says the same post jumped, ask which denominator moved.
Reach is usually something the creator sees in their own insights, and a public profile often doesn't print it. No reach number means no by-reach rate. Don't borrow the follower count and still call it "by reach," and don't estimate reach as a fraction of followers to fill the cell. An estimated denominator gives you a made-up rate.
Reach and views aren't the same thing either. Reach here is accounts. Views are plays, and one account can produce several. Dividing by 4,000 reach and dividing by 8,000 views are two separate formulas, and the example keeps them apart.
Engagement rate by views
The by-views formula divides interactions by views, then multiplies by 100: interactions ÷ views × 100.
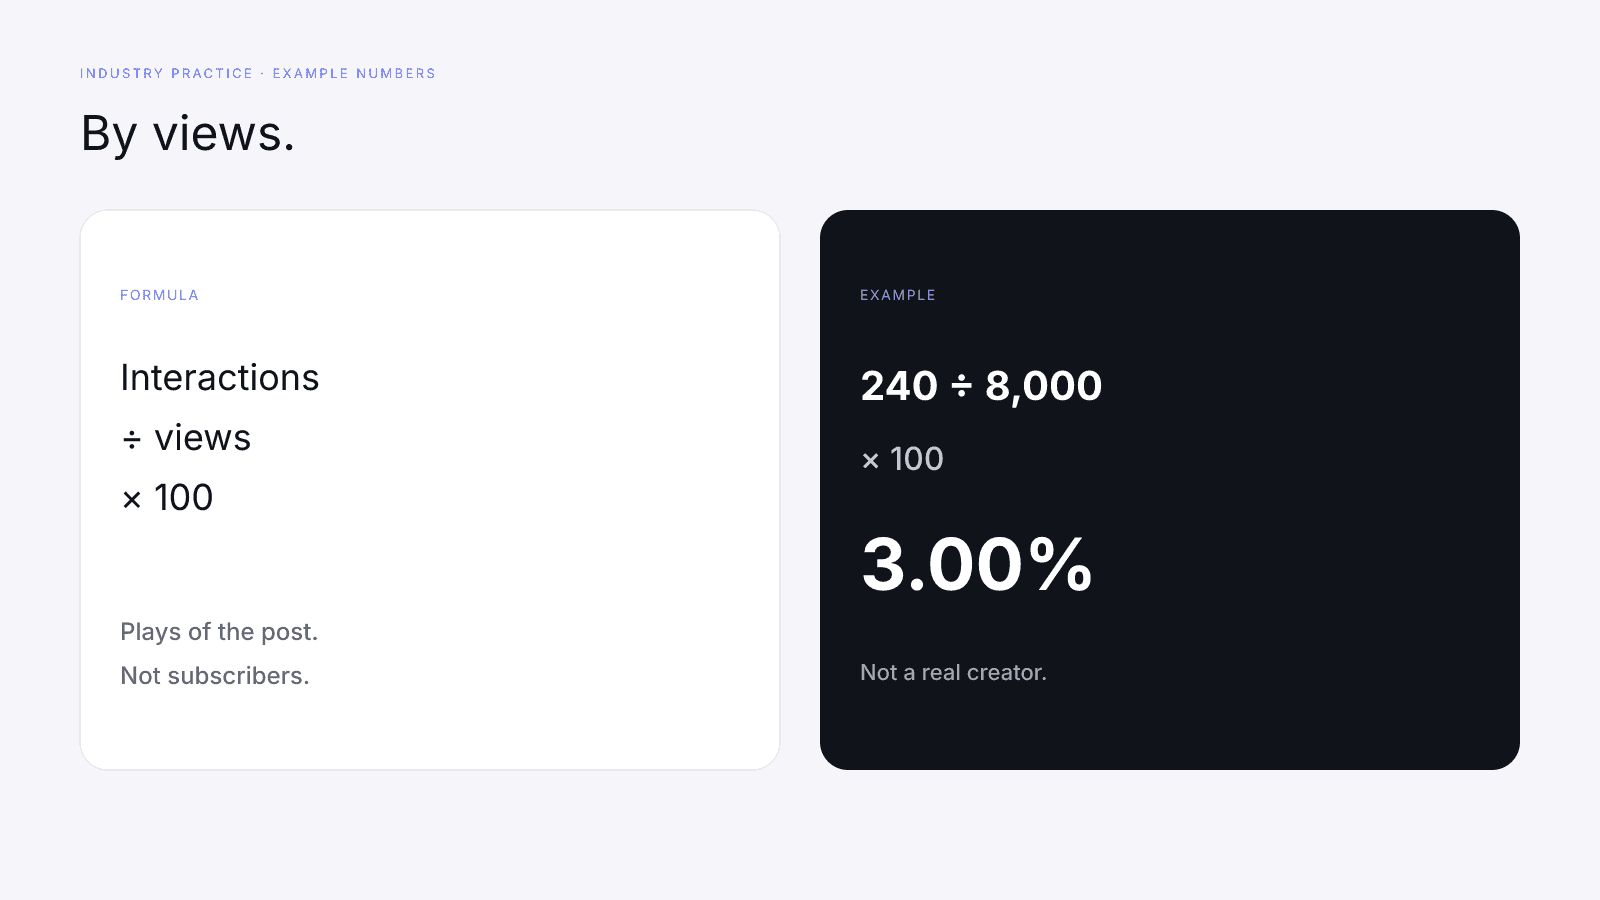
The example sets views at 8,000, so 240 ÷ 8,000 × 100 = 3.00%. On this post that lands between the by-followers and by-reach results. A different view count would land somewhere else. The order 2.00%, 3.00%, 6.00% is a fact about these three denominators, not a rule about Instagram, TikTok, or YouTube.
A view is counted when a video plays. A subscriber who never played the video isn't in the view count; someone who doesn't follow but did play it is. So a by-views rate and a by-followers rate describe different audiences, even when both come from the same upload.
If the view count is missing, leave the by-views line blank. A blank is an unfinished formula. It isn't a rate of zero, and it isn't permission to swap in followers so the column sorts.
One example post, three different rates
Every figure in this worked example is an example number. It's not a real creator, a campaign result, or a benchmark. The numerator stays fixed so the only thing changing is the denominator.
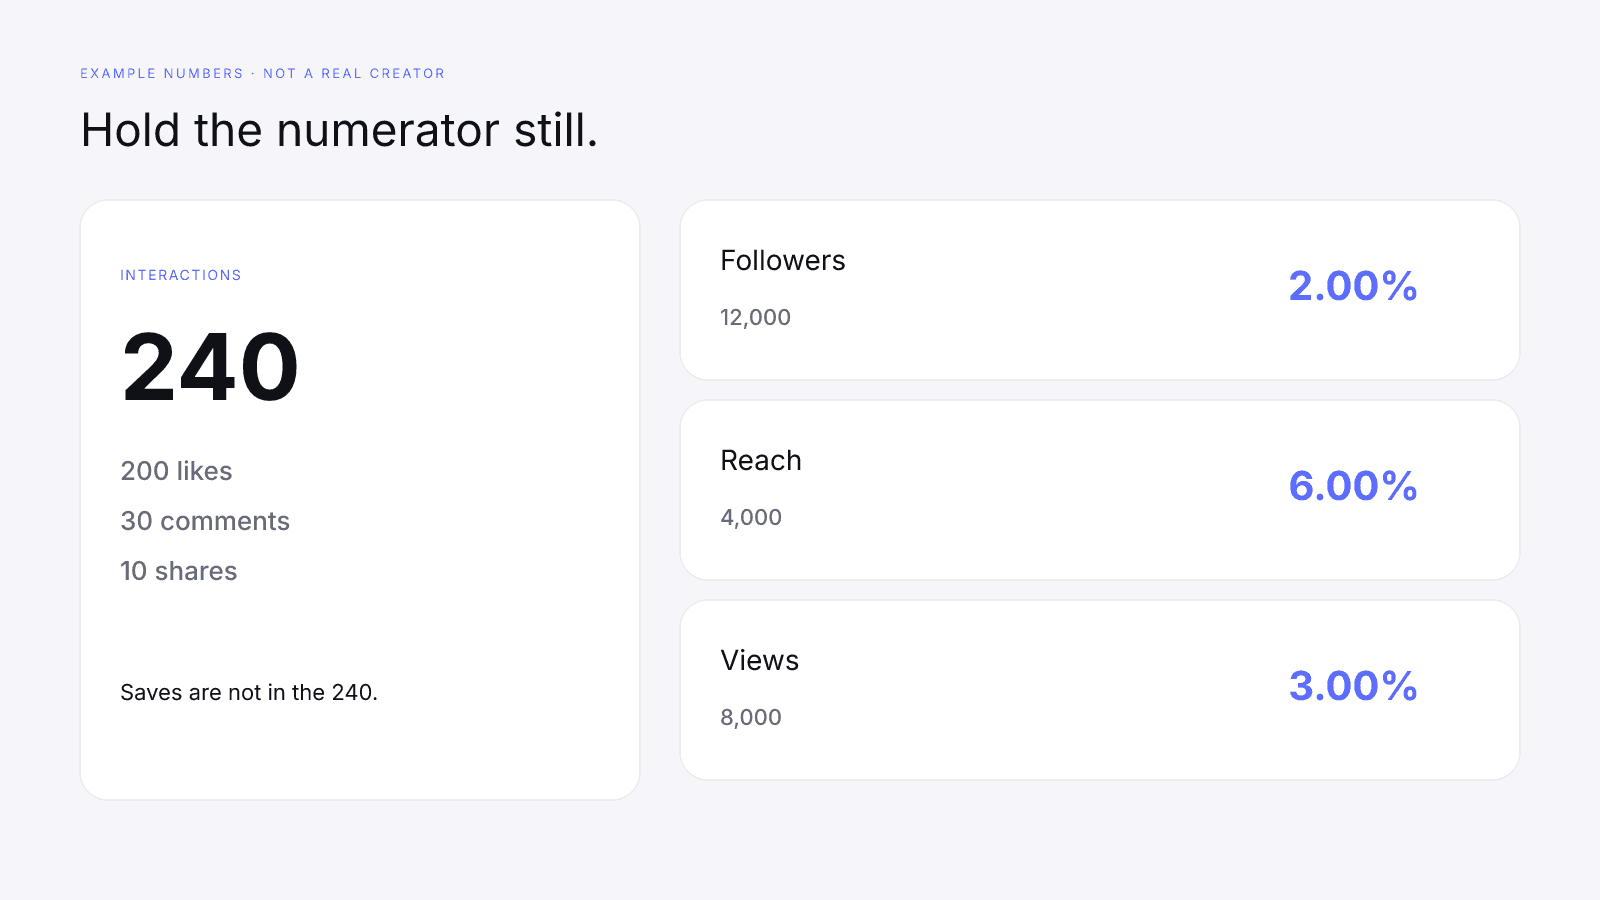
In this example post, 240 interactions make up the numerator: 200 likes, 30 comments, and 10 shares. Saves aren't included.
| Formula | Denominator in the example | Arithmetic | Example rate |
|---|---|---|---|
| By followers | 12,000 followers | 240 ÷ 12,000 × 100 | 2.00% |
| By reach | 4,000 accounts reached | 240 ÷ 4,000 × 100 | 6.00% |
| By views | 8,000 views | 240 ÷ 8,000 × 100 | 3.00% |
Check the arithmetic before you trust the labels. 240 ÷ 12,000 is 0.02, which is 2.00 after multiplying by 100. 240 ÷ 4,000 is 0.06, or 6.00. 240 ÷ 8,000 is 0.03, or 3.00. The interactions are identical in all three. By reach comes out largest here because 4,000 is the smallest denominator, not because that formula is "more accurate."
Keep the three results in three cells. Averaging the example's 2.00%, 6.00%, and 3.00% into one blended rate throws away the point of the exercise: the denominator changed the answer.
Platform differences: Instagram, TikTok, and YouTube
Each platform is usually talked about with a different denominator. That's industry habit, not three InfScore formulas. InfScore doesn't calculate engagement on any of them.
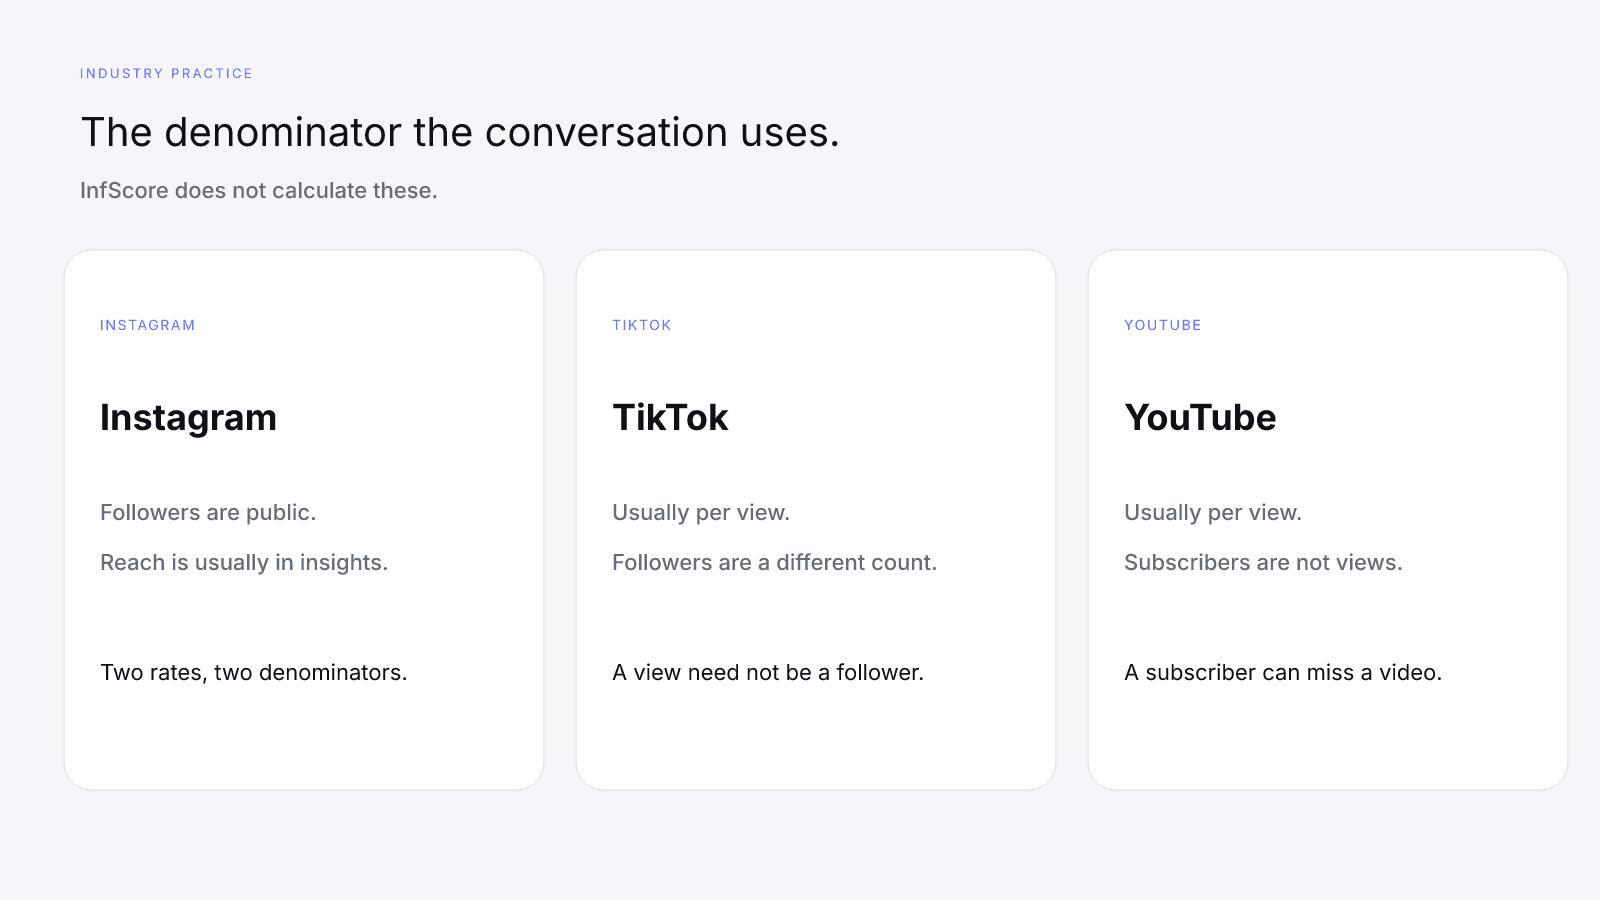
On Instagram, the public profile shows followers, while a post's reach usually sits in insights only the creator can open. With just the profile, by followers is the formula you can finish. If the creator shares a reach figure, by reach gives a second rate for the same interactions. Write both, each with its denominator, rather than collapsing them into one "Instagram engagement rate." Neither result is an InfScore input. For the factor map on a public Instagram lookup, see Instagram InfScore Factors; this page doesn't repeat it.
On TikTok, the usual public formula is per view: interactions divided by views. Followers are a separate count, and a viewer doesn't have to follow the account. TikTok Reach vs Engagement explains the two InfScore rows on a TikTok lookup: reach and momentum at 23% and engagement strength at 27% on model 2026-08-18.1. Those are factor weights. They don't mean the TikTok row came from dividing interactions by views, reach, or followers.
On YouTube, the usual public formula is also per view. Subscribers aren't views. People who don't subscribe can watch a video, and subscribers can miss an upload. YouTube Momentum Signals covers how public YouTube reach reads on the score. It doesn't turn a subscriber count into an engagement denominator, and neither will this page.
On any of the three, fix the numerator before you compare a creator's own sheet with a number you worked out from the profile. If their sheet counts saves and yours doesn't, the gap may be the numerator. If theirs says views and yours says followers, it's the denominator. Note which one you're looking at. A pitch that quotes "engagement" with no denominator hasn't finished the sum.
Bought comments and engagement pods are a separate problem from the denominator, covered in Why Engagement Pods Usually Hurt Public Influence Scores. Switching denominators doesn't tell you whether the interactions were genuine, and relabelling a pod's numbers as "by reach" doesn't change what they are.
What InfScore does with engagement rate
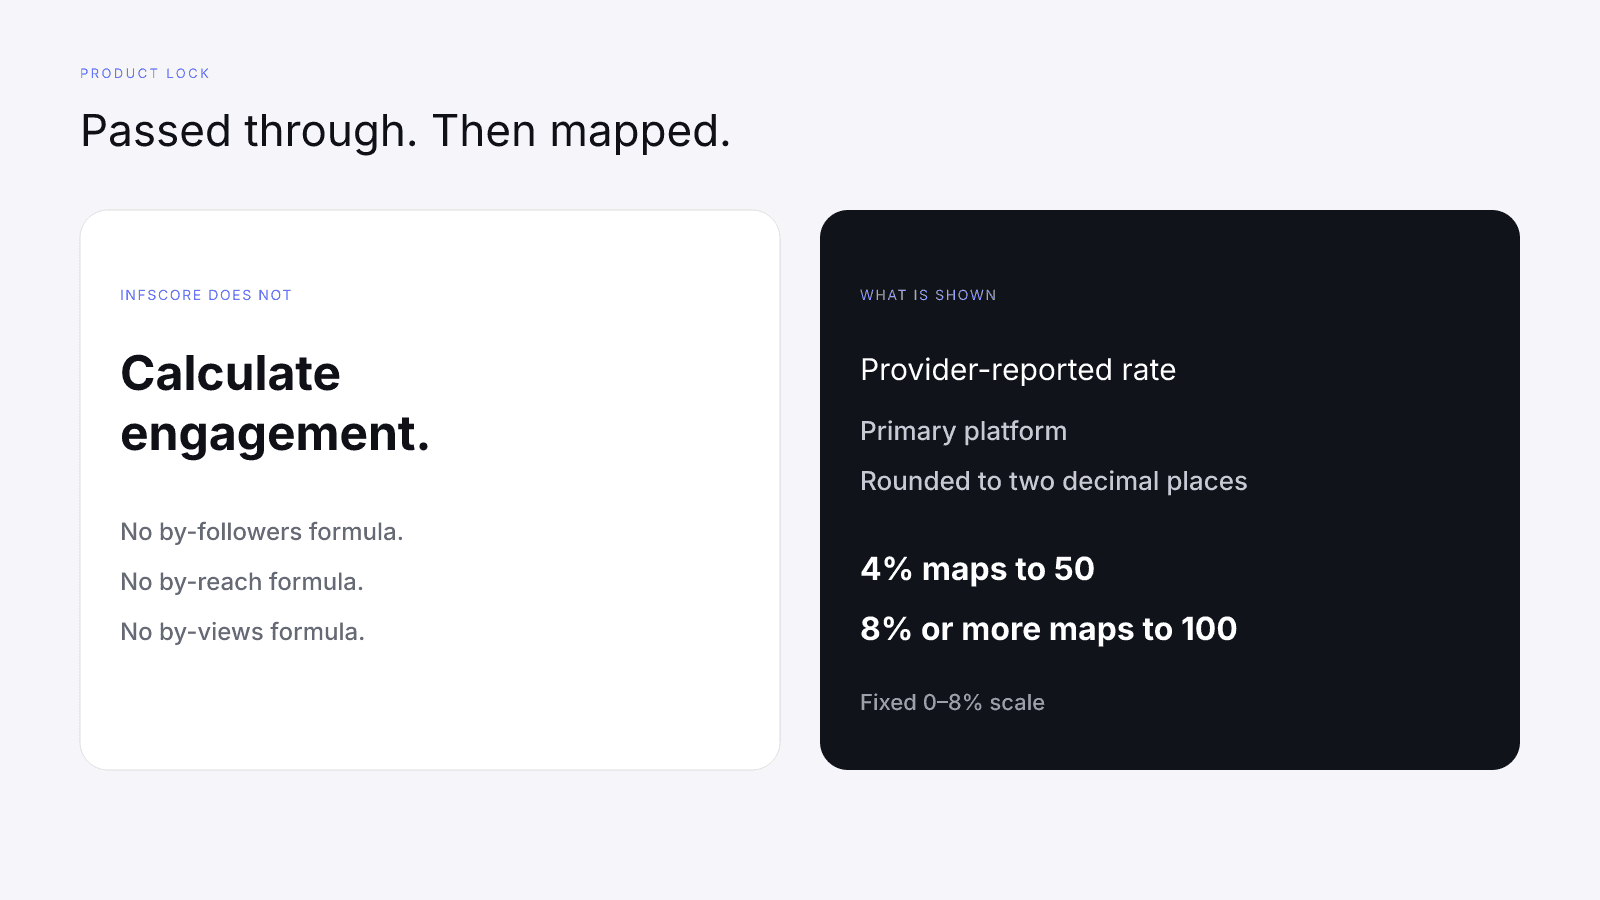
InfScore doesn't calculate engagement, and there's no per-platform formula inside the score. Nothing in it divides interactions by followers, reach, or views. InfScore uses the provider-reported public engagement rate for the primary platform, rounded to two decimal places, and maps it onto a fixed 0–8% scale (4%→50, ≥8%→100). The rate is passed through as reported. This guide won't guess which denominator the provider used, because guessing would invent a formula the product doesn't apply.
The primary platform is the one you searched. A YouTube URL and an Instagram URL for the same person are two lookups, and each card's Avg. engagement is the provider-reported rate for that search's platform, rounded to two decimal places. Search a public profile on infscore.com and read the figure that's actually printed. To practice on a live card, open MrBeast on YouTube. This page doesn't quote that card, or a paid module for that creator or anyone else.
The mapping is a separate step from the rate. Engagement strength takes the provider-reported rate, divides it by 8, multiplies by 100, rounds, and caps the result at 100. So 4% maps to 50 and 8% or more maps to 100. A headline rate can print above 8% while the factor score stops at 100. Whether a given rate is good is a different question, answered in what a good engagement rate looks like.
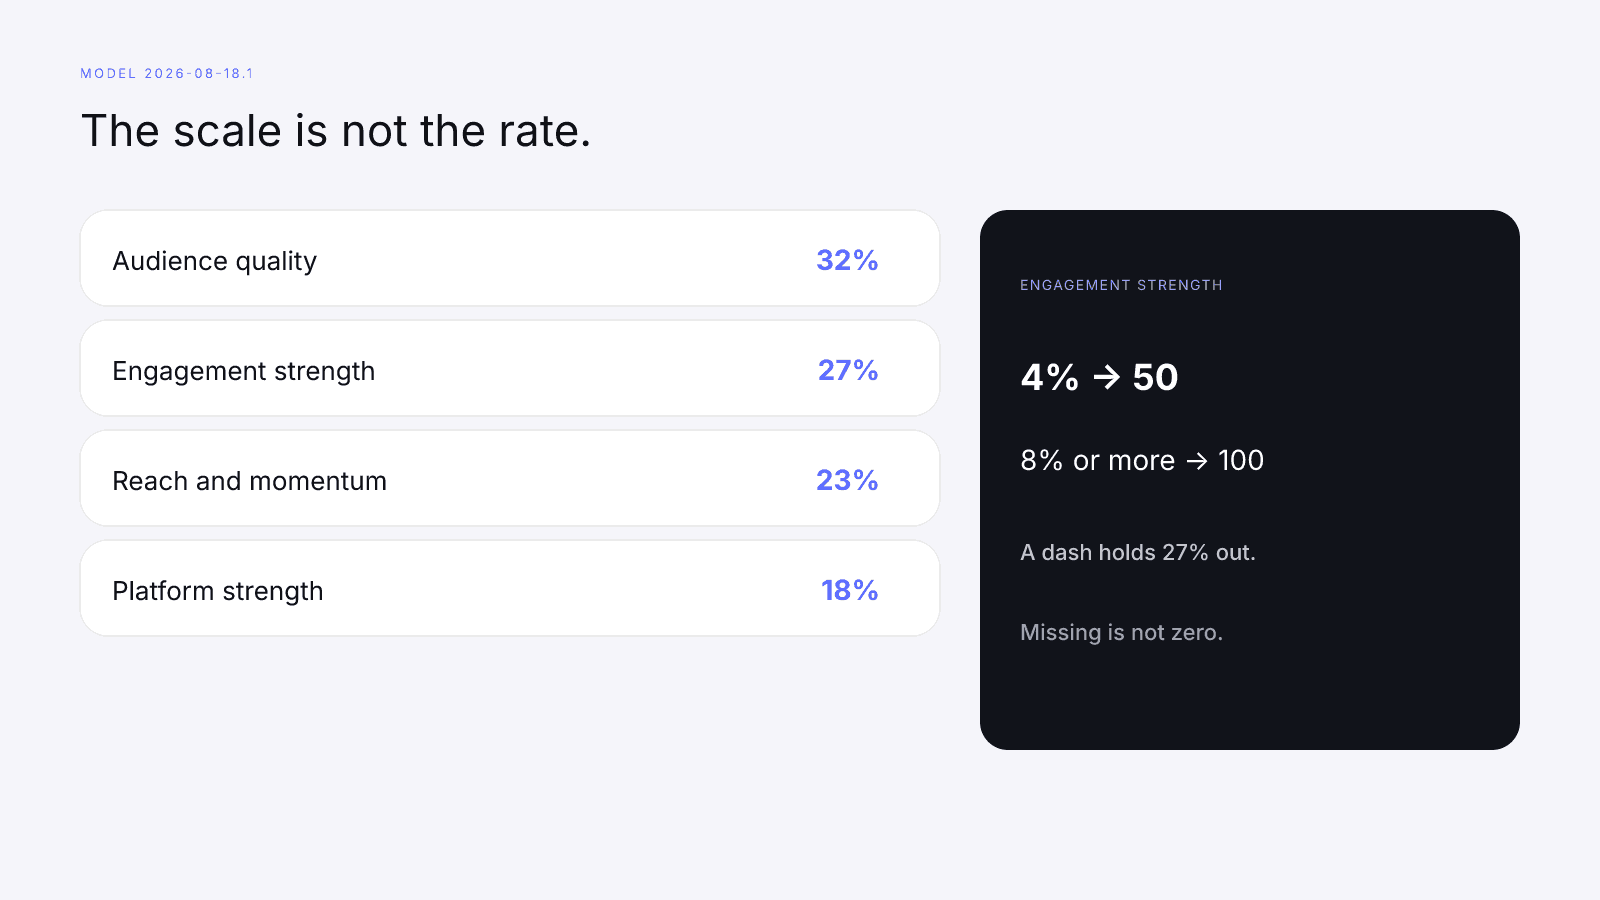
On model 2026-08-18.1 the weights are audience quality 32%, engagement strength 27%, reach and momentum 23%, and platform strength 18%. Engagement strength is one row, so a 50 there means a 4% provider rate, not a 50 InfScore. The composite combines the rows that returned a number, at those published weights; How to Measure Influencer Performance is the full reading. If the card prints a different model id, read Comparing InfScore Across Model Versions before you treat two cards as the same scale.
A missing rate doesn't become a zero. The engagement-strength row shows a dash and the 27% weight on model 2026-08-18.1 is held out, while the free card's Avg. engagement prints Unavailable. That's one gap shown two ways: Unavailable on the headline stat, a dash on the factor row. Missing Data on Creator Metrics explains how the remaining weights rebalance. Don't type 0 into a sheet to make the column sort. A returned rate of zero is a number; a missing rate isn't.
Free Avg. engagement vs paid Avg engagement
The free card and the paid summary use different labels, and they don't have to match.
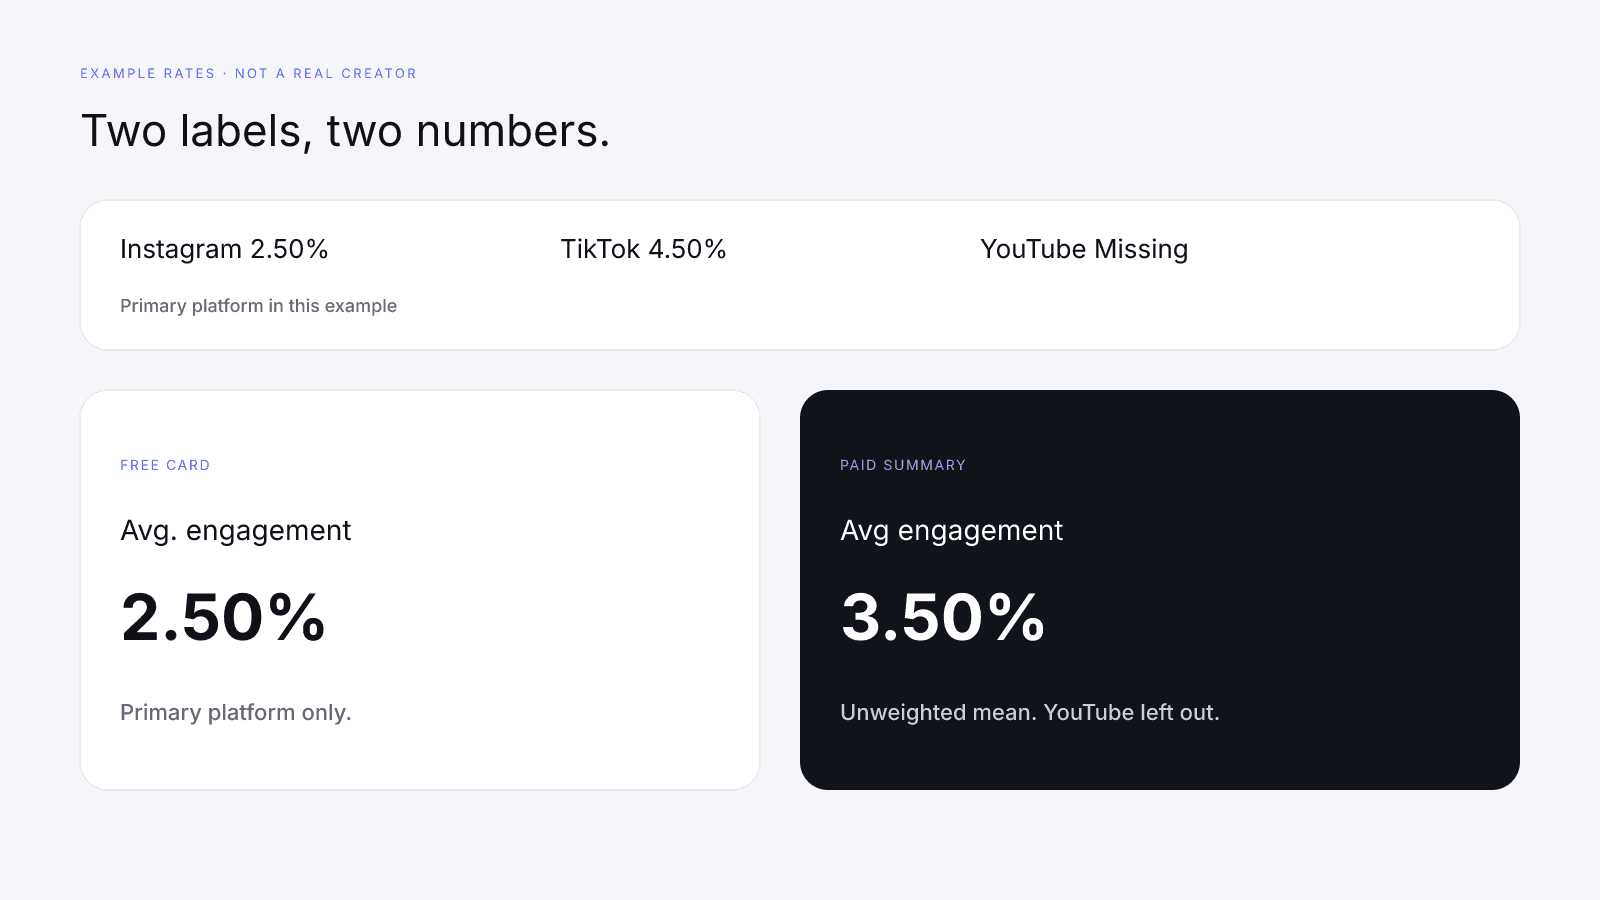
Free-card "Avg. engagement" is the primary platform only: the provider-reported rate for the profile you searched, rounded to two decimal places. Paid-summary "Avg engagement" is a plain unweighted average across platforms that have a rate. Each of those platforms counts once, and follower count doesn't weight it. A platform with no rate is left out rather than entered as zero, so it doesn't drag the mean down.
These rates are example numbers, not a real creator.
| Platform on the example | Provider-reported rate |
|---|---|
| Instagram, and the platform you searched | 2.50% |
| TikTok | 4.50% |
| YouTube | Missing |
In this example, the free card, opened on Instagram, prints Avg. engagement 2.50%. The paid summary averages the rows with a rate, (2.50 + 4.50) ÷ 2 = 3.50, so Avg engagement prints 3.50% across Instagram and TikTok, with YouTube left out. If someone "fixes" the blank with a zero, the mean becomes (2.50 + 4.50 + 0) ÷ 3 = 2.33, a number the product never computed. Leave the missing platform out.
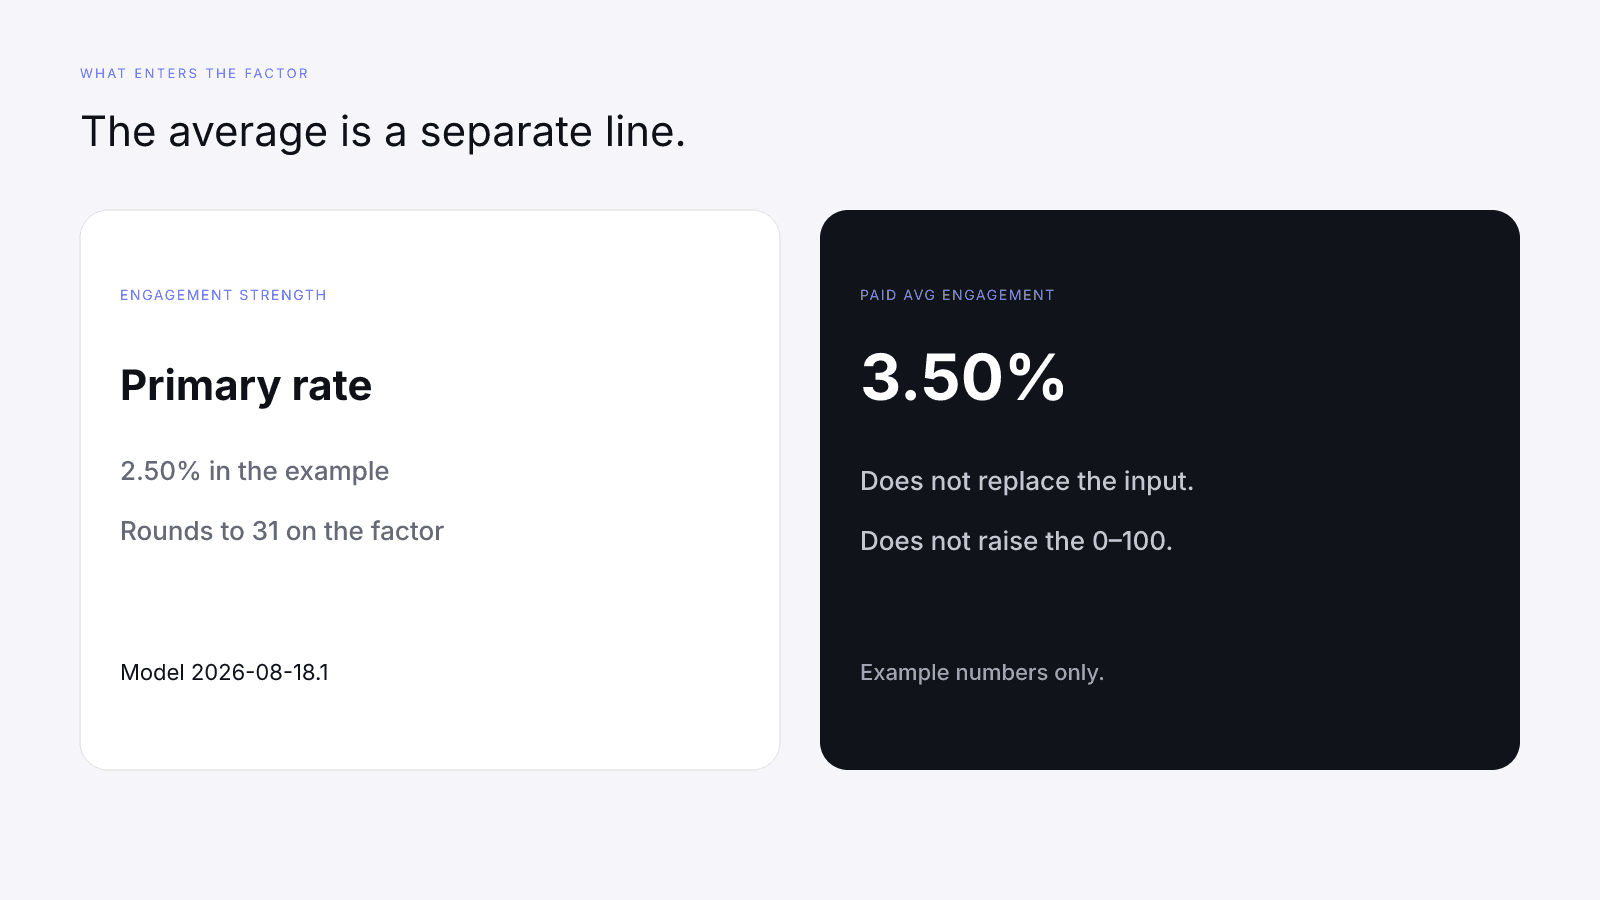
The engagement-strength input is still the primary platform's provider-reported rate, 2.50% in this example. Divided by 8 and multiplied by 100, that rounds to 31 on engagement strength. The 3.50% paid line doesn't replace that input or raise the 0–100. If only one platform has a rate, the mean equals that rate and the two labels match. They only diverge when two or more platforms have rates and those rates differ.
Free InfScore vs the $0.99 Report covers what else the unlock adds. The $0.99 report is a one-time purchase, not a subscription. It is the full creator report, with audience, growth, and platform deep dives when they exist. Paying doesn't change the 32/27/23/18 weights on model 2026-08-18.1, fill a dash, or raise a score. Pricing is one report.
Similar creators, and a missing rate
The paid report can include a section called "Engagement vs similar creators." It compares the creator's rate on that platform with lookalikes the provider returned, at most 8 of them. It isn't a benchmark or a market average; eight names or fewer can't stand in for a category.
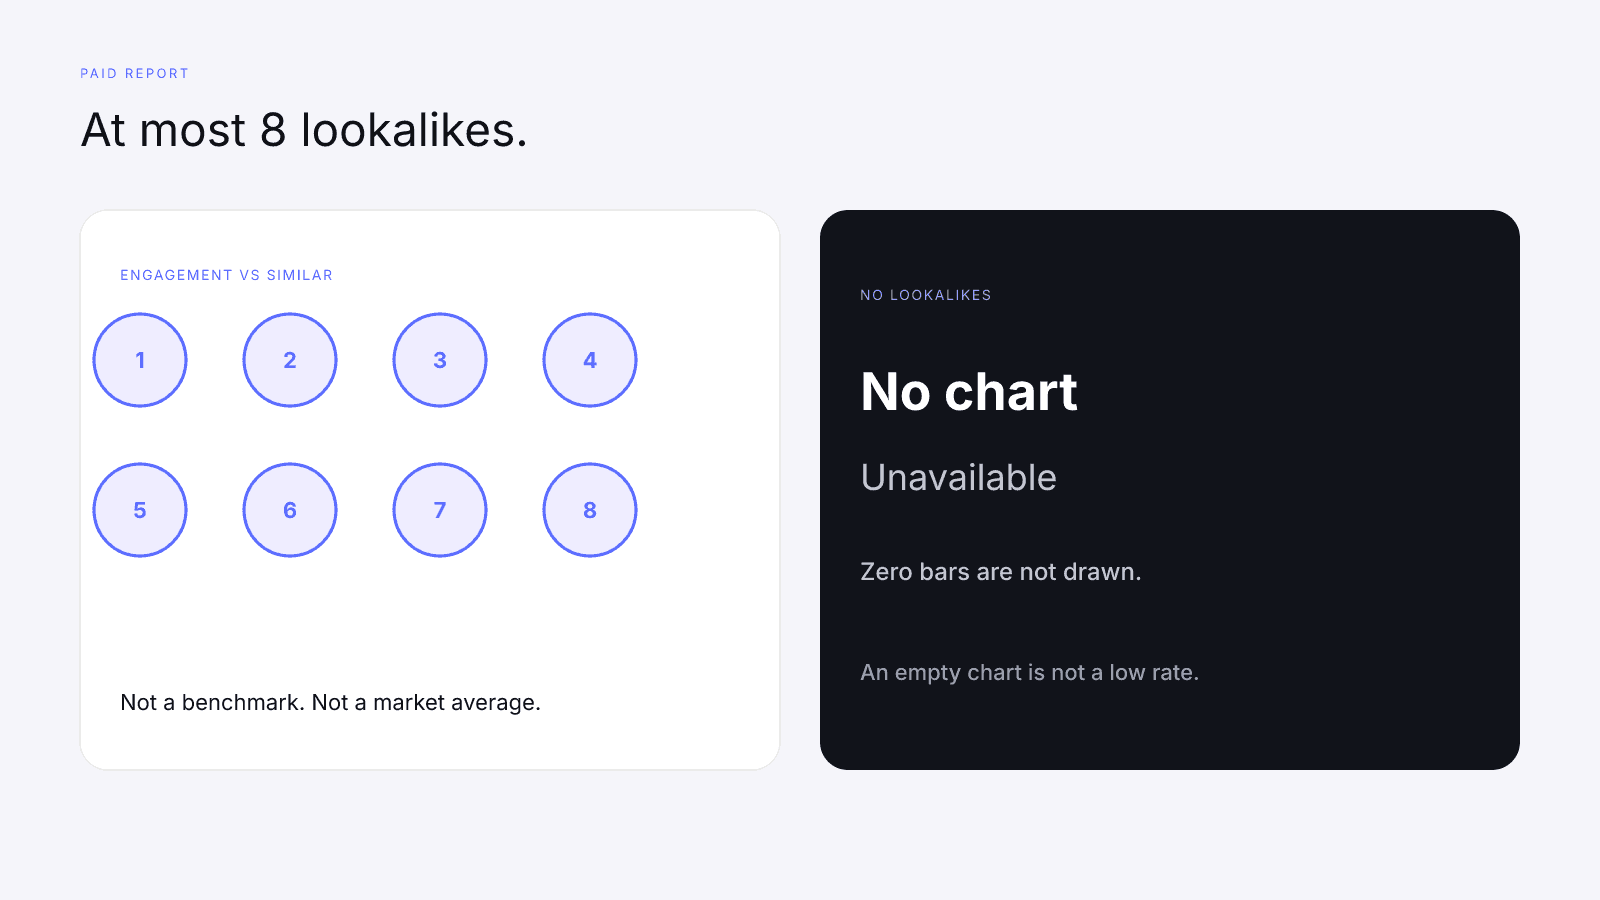
No lookalikes means no chart, not a row of zero bars. The section prints Unavailable when similar-creator engagement rates weren't returned for that platform. An empty section says nothing about whether the creator's rate is low, or about where similar creators sit. There's just nothing to plot. When the chart does show, its median mark is the median of the lookalikes returned, which still isn't a market average.
Don't paste the chart into a deck as "the niche benchmark." The product doesn't publish one. To read a rate alongside the other factors, use what a good engagement rate looks like, and keep the model id beside any weight you quote. On model 2026-08-18.1 those weights are still audience quality 32%, engagement strength 27%, reach and momentum 23%, and platform strength 18%.
When you log a creator, keep your hand formulas and the card on separate lines.
| Field | What to write |
|---|---|
| Interactions | Which actions you counted, and the count. Example shape: likes, comments, shares |
| By followers | Interactions ÷ followers × 100, or blank if you have no follower count |
| By reach | Interactions ÷ reach × 100, or blank if reach was not provided |
| By views | Interactions ÷ views × 100, or blank if views were not provided |
| Avg. engagement | The free-card figure for the primary platform, or Unavailable |
| Engagement strength | The 0–100 factor on model 2026-08-18.1, or a dash |
| Avg engagement | The paid unweighted mean, and the platform names it included, or not opened |
| Similar creators | At most 8 lookalikes, or Unavailable. Not a benchmark |
A blank formula cell means the denominator was missing. A dash on engagement strength means the provider rate was missing and the 27% weight on model 2026-08-18.1 is held out. Neither is a zero you made up to keep the spreadsheet tidy, and the $0.99 report doesn't fill either gap. Open the free card, copy the model id and the printed rate, and label every rate you calculate by hand with the denominator behind it.
FAQ
How do you calculate engagement rate?
Industry practice divides a chosen set of interactions by a denominator, then multiplies by 100. The common denominators are followers, reach, and views. On this guide's example post (240 interactions, not a real creator), by followers is 2.00%, by reach is 6.00%, and by views is 3.00%. InfScore does not calculate engagement. InfScore uses the provider-reported public engagement rate for the primary platform, rounded to two decimal places, and maps it onto a fixed 0–8% scale (4%→50, ≥8%→100).
What is the engagement rate formula on Instagram?
Common practice is interactions (for example likes, comments, and shares; some counts add saves) ÷ followers × 100, or ÷ reach × 100 when you have insights access. In the example post, whose interactions are likes, comments, and shares only, that is 2.00% by followers and 6.00% by reach (example numbers).
How is engagement rate calculated on TikTok and YouTube?
Both are usually calculated per view: interactions ÷ views × 100. In the example post that is 3.00% (example numbers). InfScore does not run this formula.
Should I calculate engagement rate by followers or by reach?
Use followers to compare public profiles, because anyone can see the count. Use reach when you own the account's insights. Never compare a reach rate against a follower rate.
Does InfScore calculate engagement rate?
No. InfScore does not calculate engagement, and it has no per-platform formula. It passes the provider-reported public rate through for the primary platform. That rate is rounded to two decimal places and mapped onto a fixed 0–8% scale, where 4% maps to 50 and 8% or more maps to 100. On model 2026-08-18.1, engagement strength is 27%, beside audience quality 32%, reach and momentum 23%, and platform strength 18%.
Why does my calculated rate differ from my InfScore card?
Your number uses your own interactions and denominator. The card passes through the provider-reported public rate for the primary platform, rounded to two decimal places, so a different formula, time window or post set gives a different figure.
Is my engagement rate good?
That depends on platform, size and goal, and this guide does not grade rates; see what a good engagement rate looks like.